About the Survey
Between September 7th and 25th 2026 we ran a poll via Survey Monkey's Target Audience.
The survey was sent to members of the Survey Monkey panel who are residents of Newfoundland & Labrador aged 18+. A total of 210 responses were logged. While no screening questions were used during the survey, respondents were asked to provide the first 3 characters of their postal codes,
along with their provincial electoral district or federal electoral riding as a means to determine the validity of the data being received. Responses were weighted by age, gender, and region based on data from the 2021 Canadian Census.
Estimated margin of error based on sample size is +/- 6.8%.
A link to the full report can be found HERE.
PART 1: Opinions on the MOU
Respondents were asked the following question:
As you may know, the Newfoundland & Labrador Government recently signed a MOU regarding Churchill Falls with the Government of Quebec. How do you feel about the current MOU?
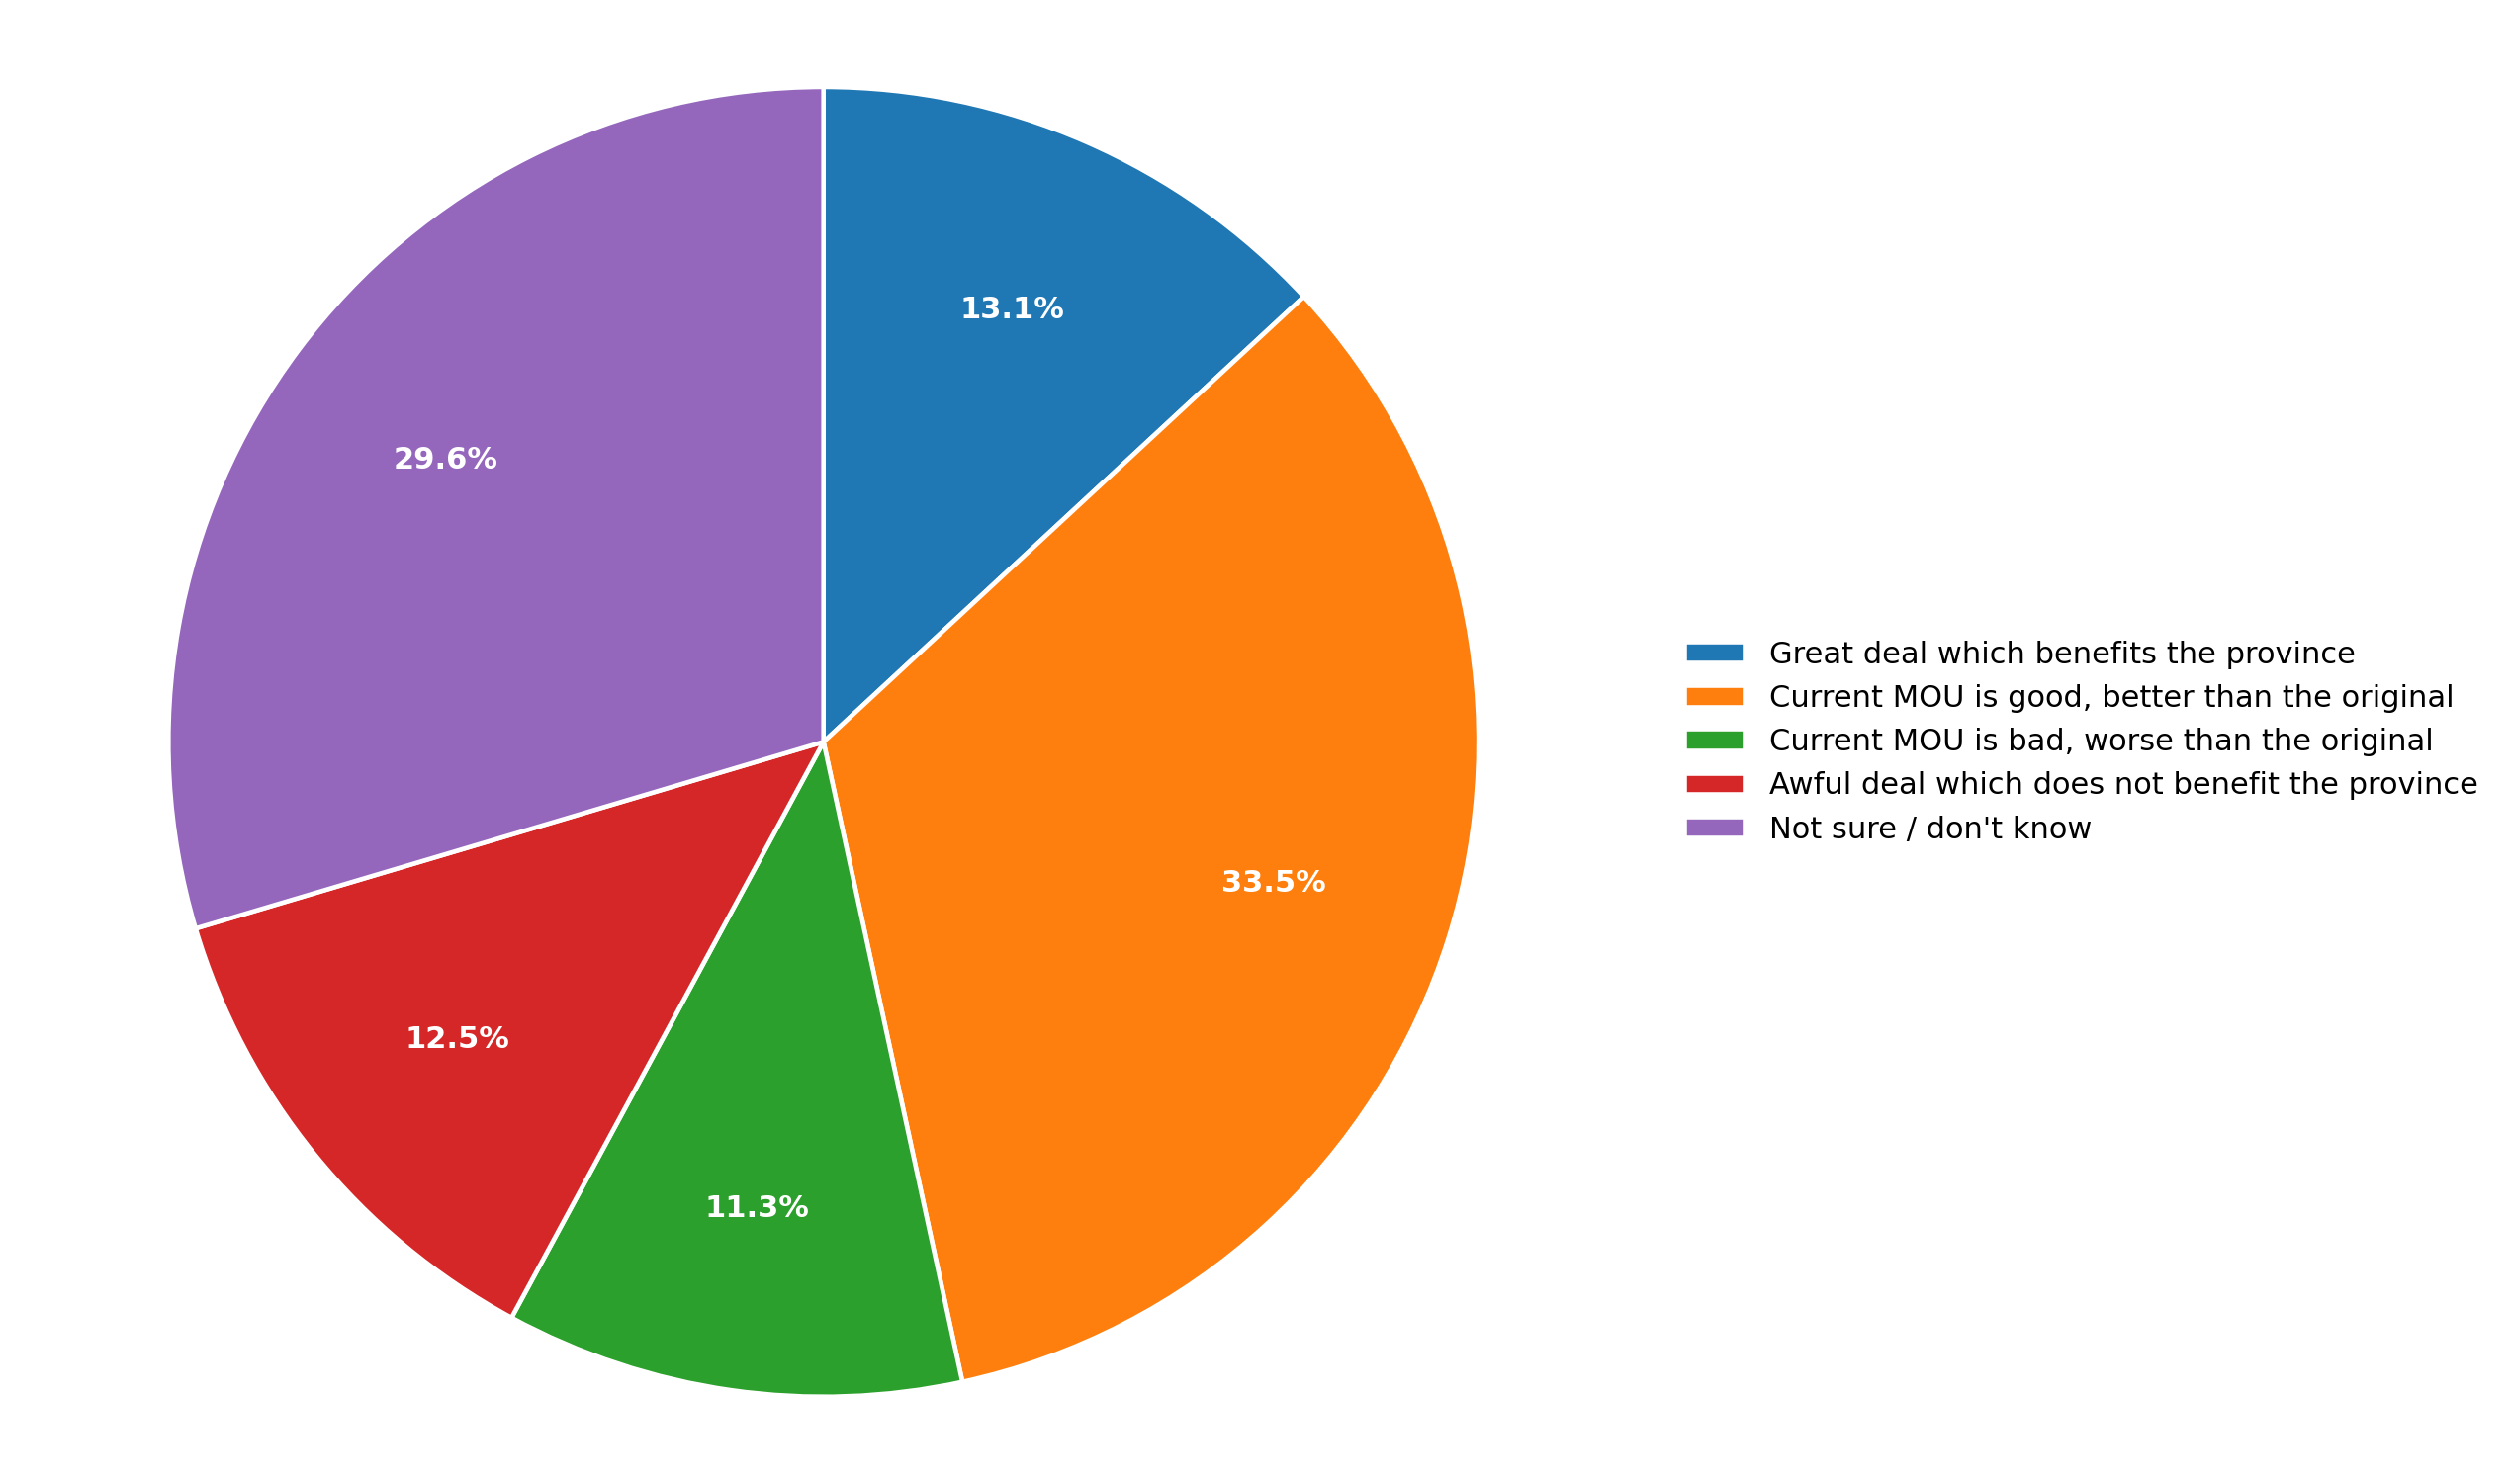
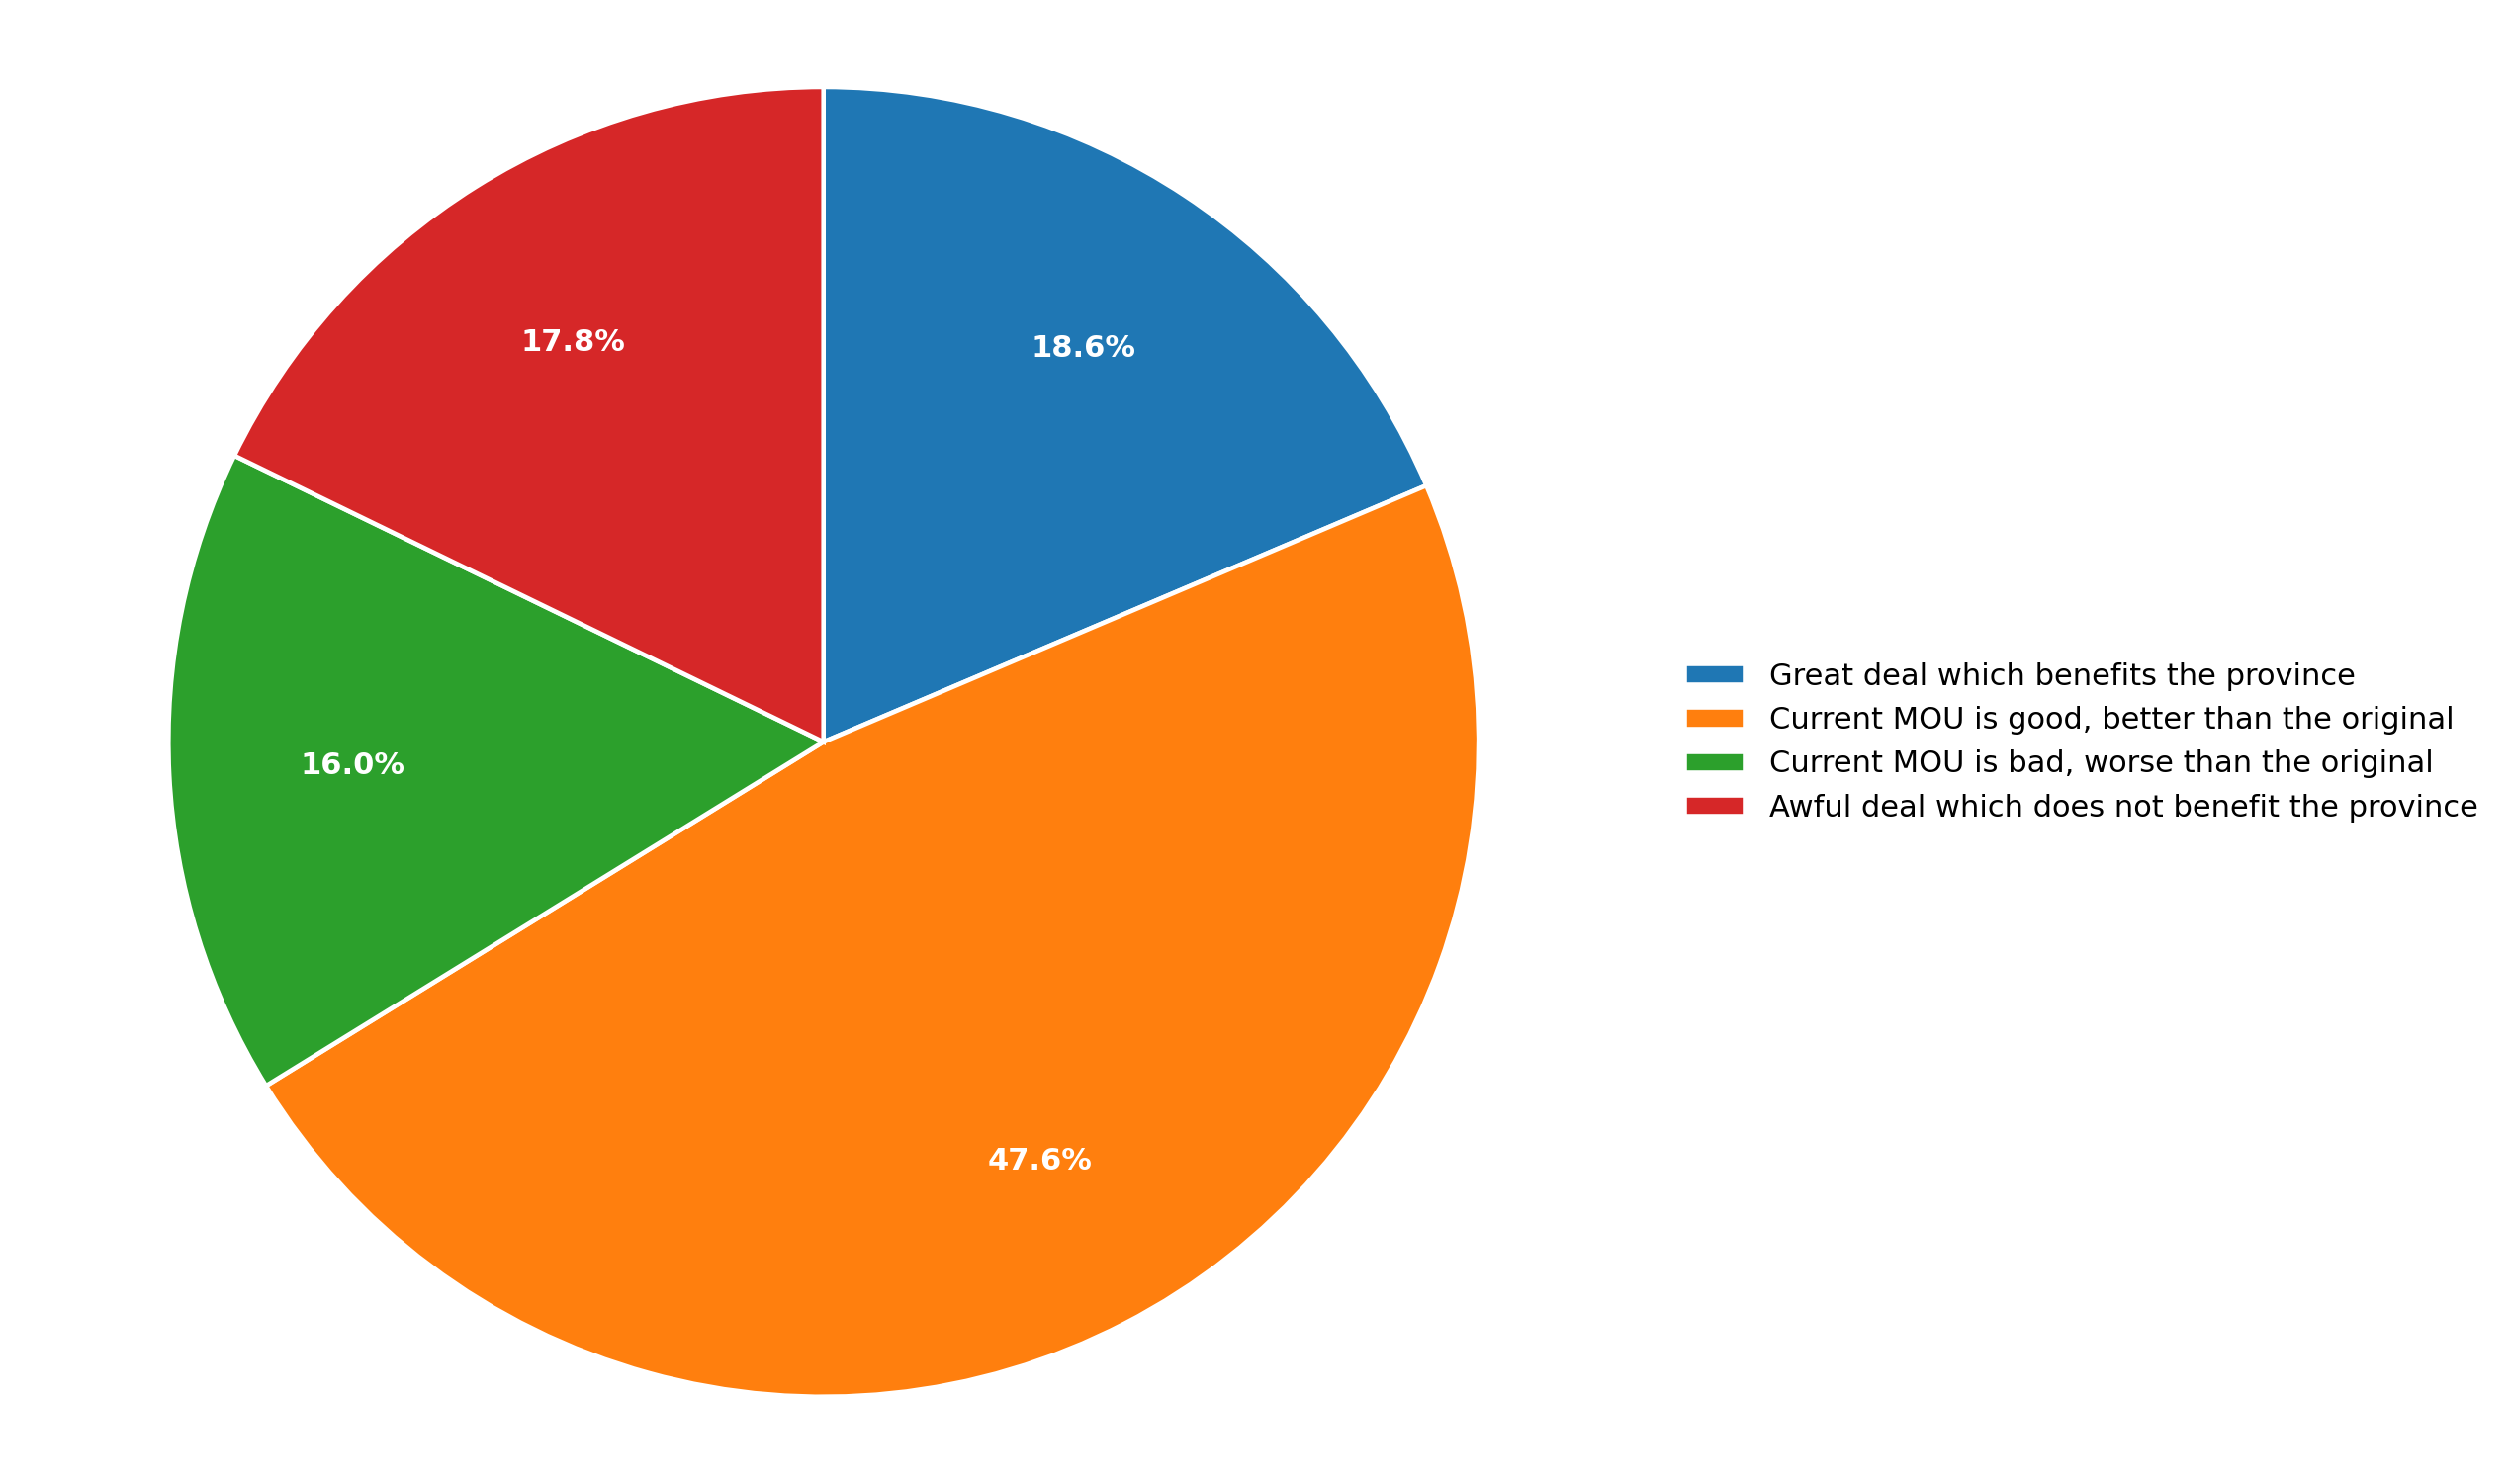
A large number of respondents believe that the MOU negotiated under Tony Wakeham's Progressive Conservative government is good, and is better than the MOU previously negotiated by Andrew Furey and his Liberal government.
Also, unsurprisingly, almost 30% of respondents truly do not know how to feel about the MOU, which is truthfully a very honest and appropriate response to a rather complex deal. As seen below, among those who have an opinion on the MOU, nearly half of them believe the current MOU is good, and better than the previous deal.
Opinion based on Vote Intention
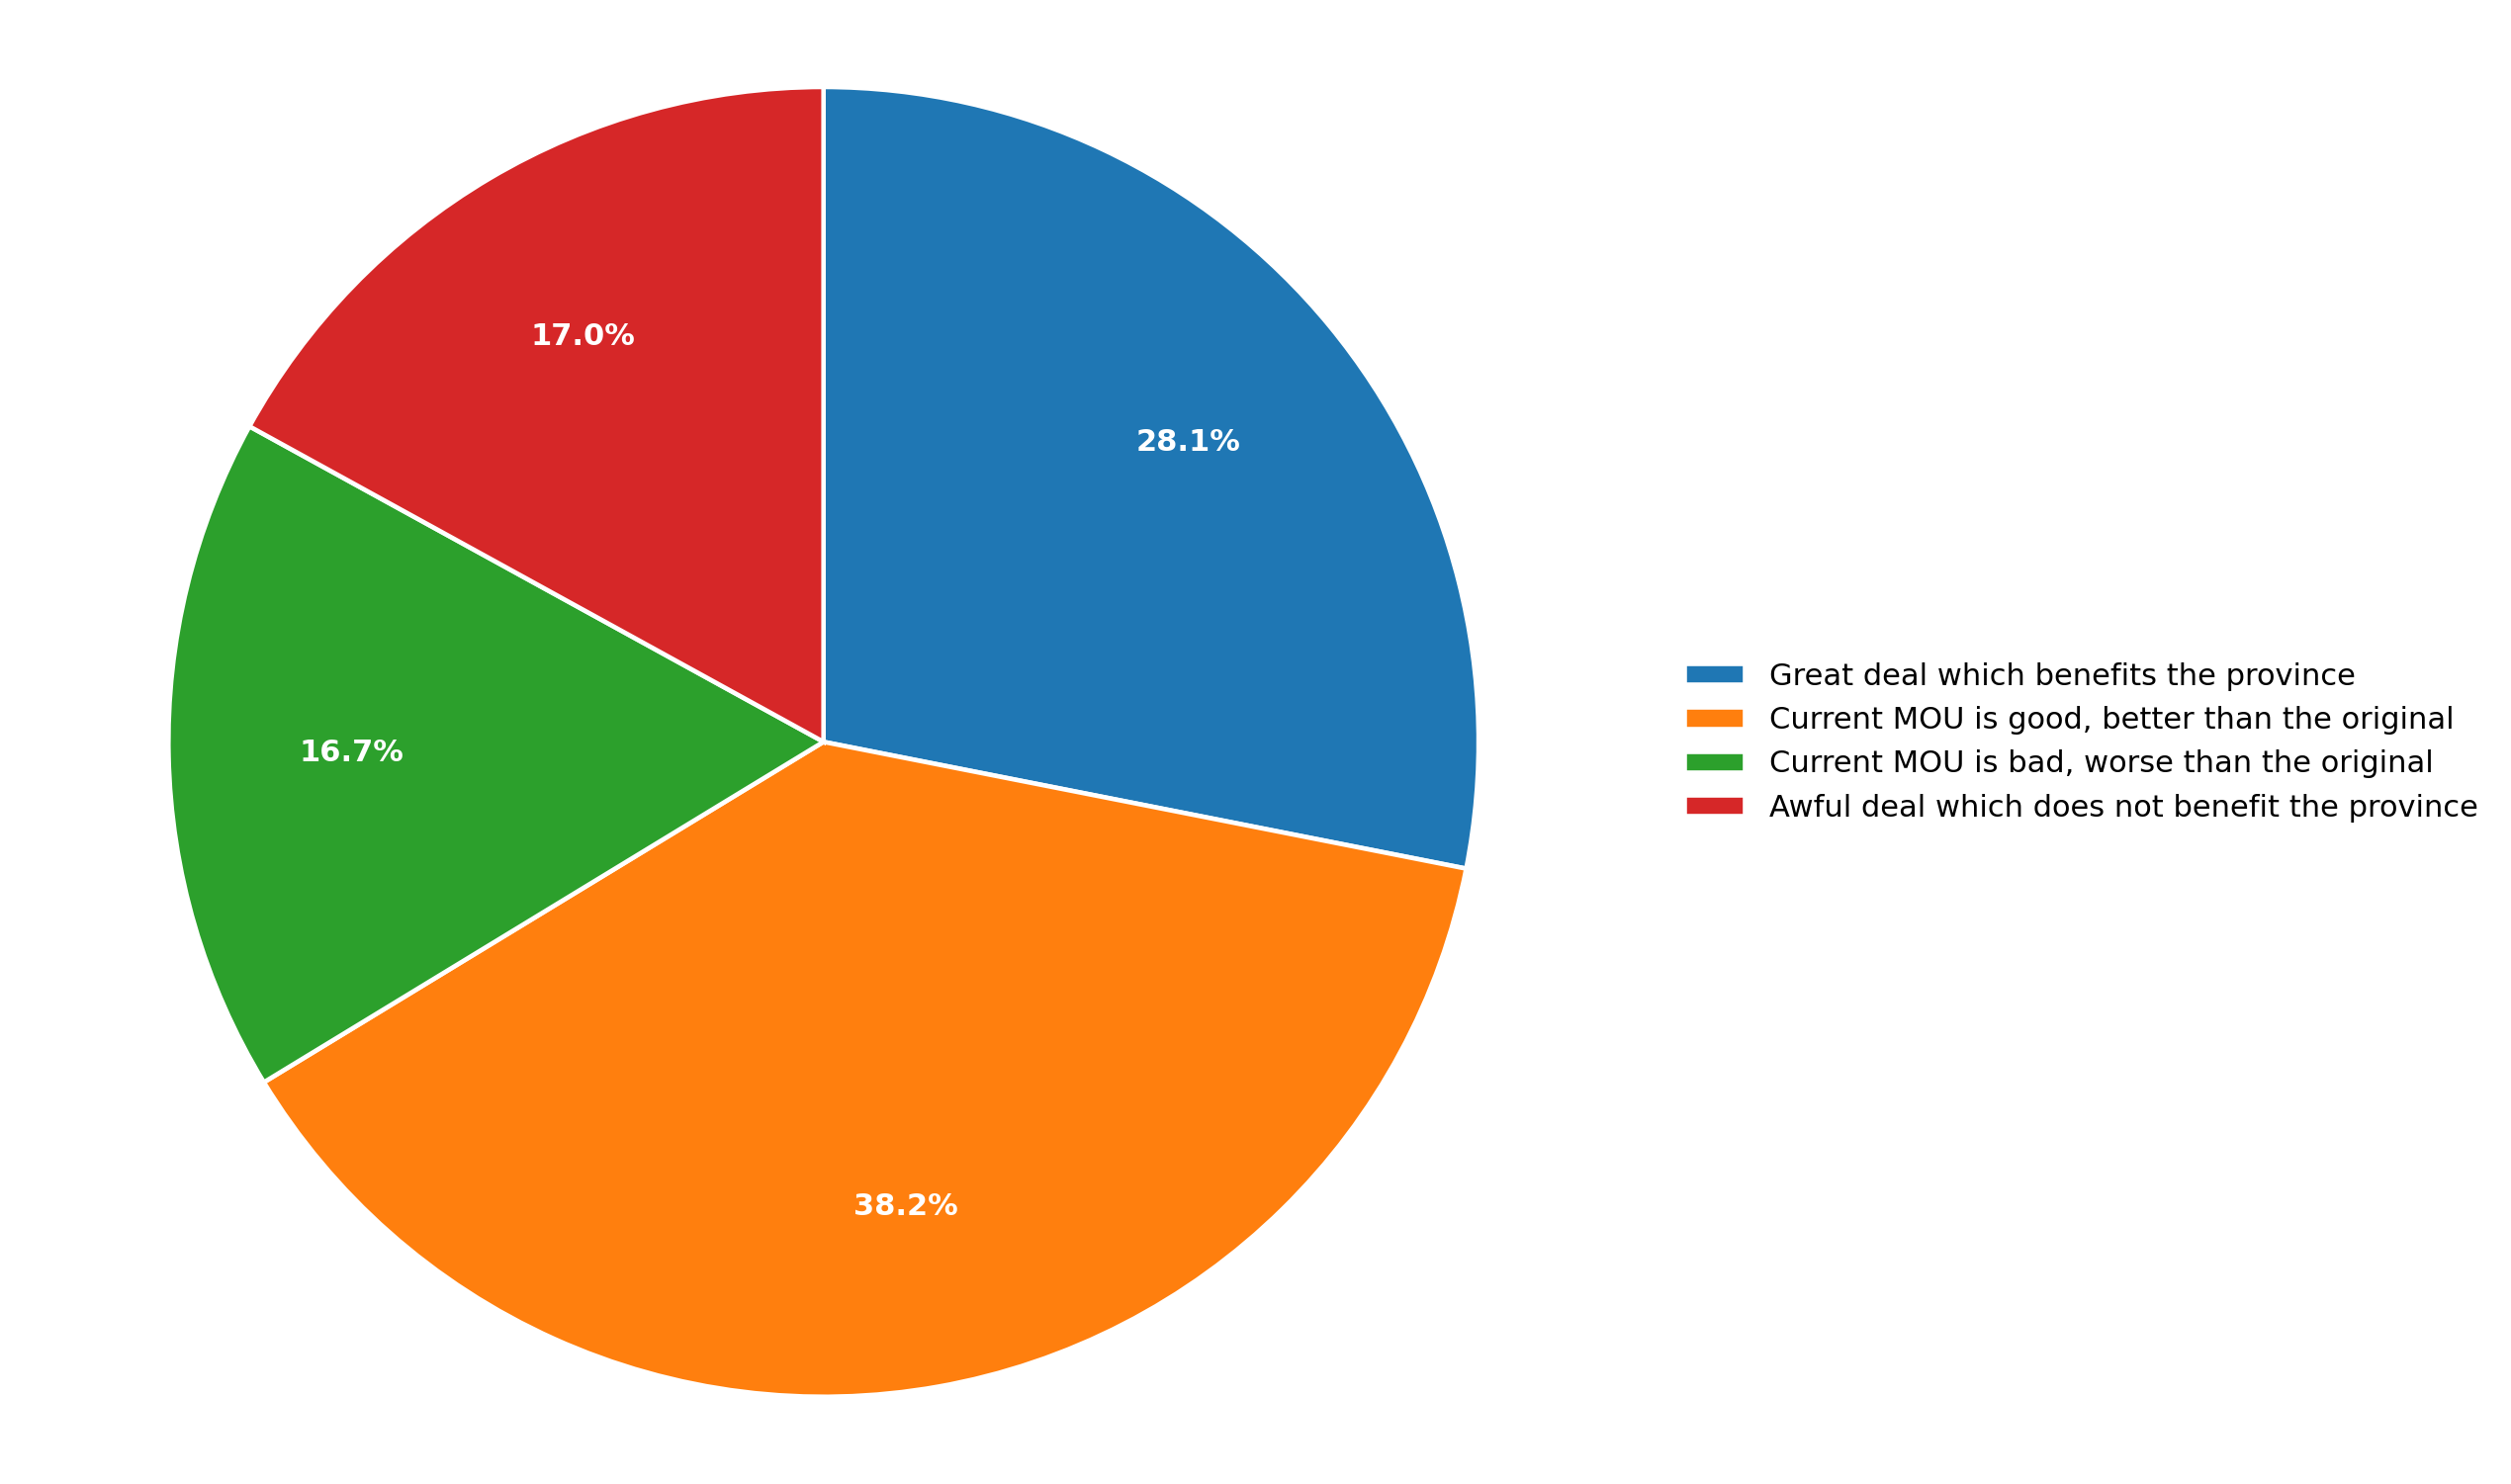
When looking at opinions based on the indicated provincial vote intentions, Liberals were most likely to have an opinion on the MOU, with only 19% of Liberal voters indicating they didn't know how to feel about the deal. 26% of Progressive Conservative voters indicated they didn't know how to feel about the dea, with 31% of NDP voters indicating they did not know how to feel.
Again, when only comparing responses with an opinion on the MOU, we see that two-thirds of Liberal voters think the deal is good in one way or another. Only 17% of Liberal voters believe the new MOU is worse than the previous MOU negotiated by the prior Liberal government.
Decided Liberal Voters
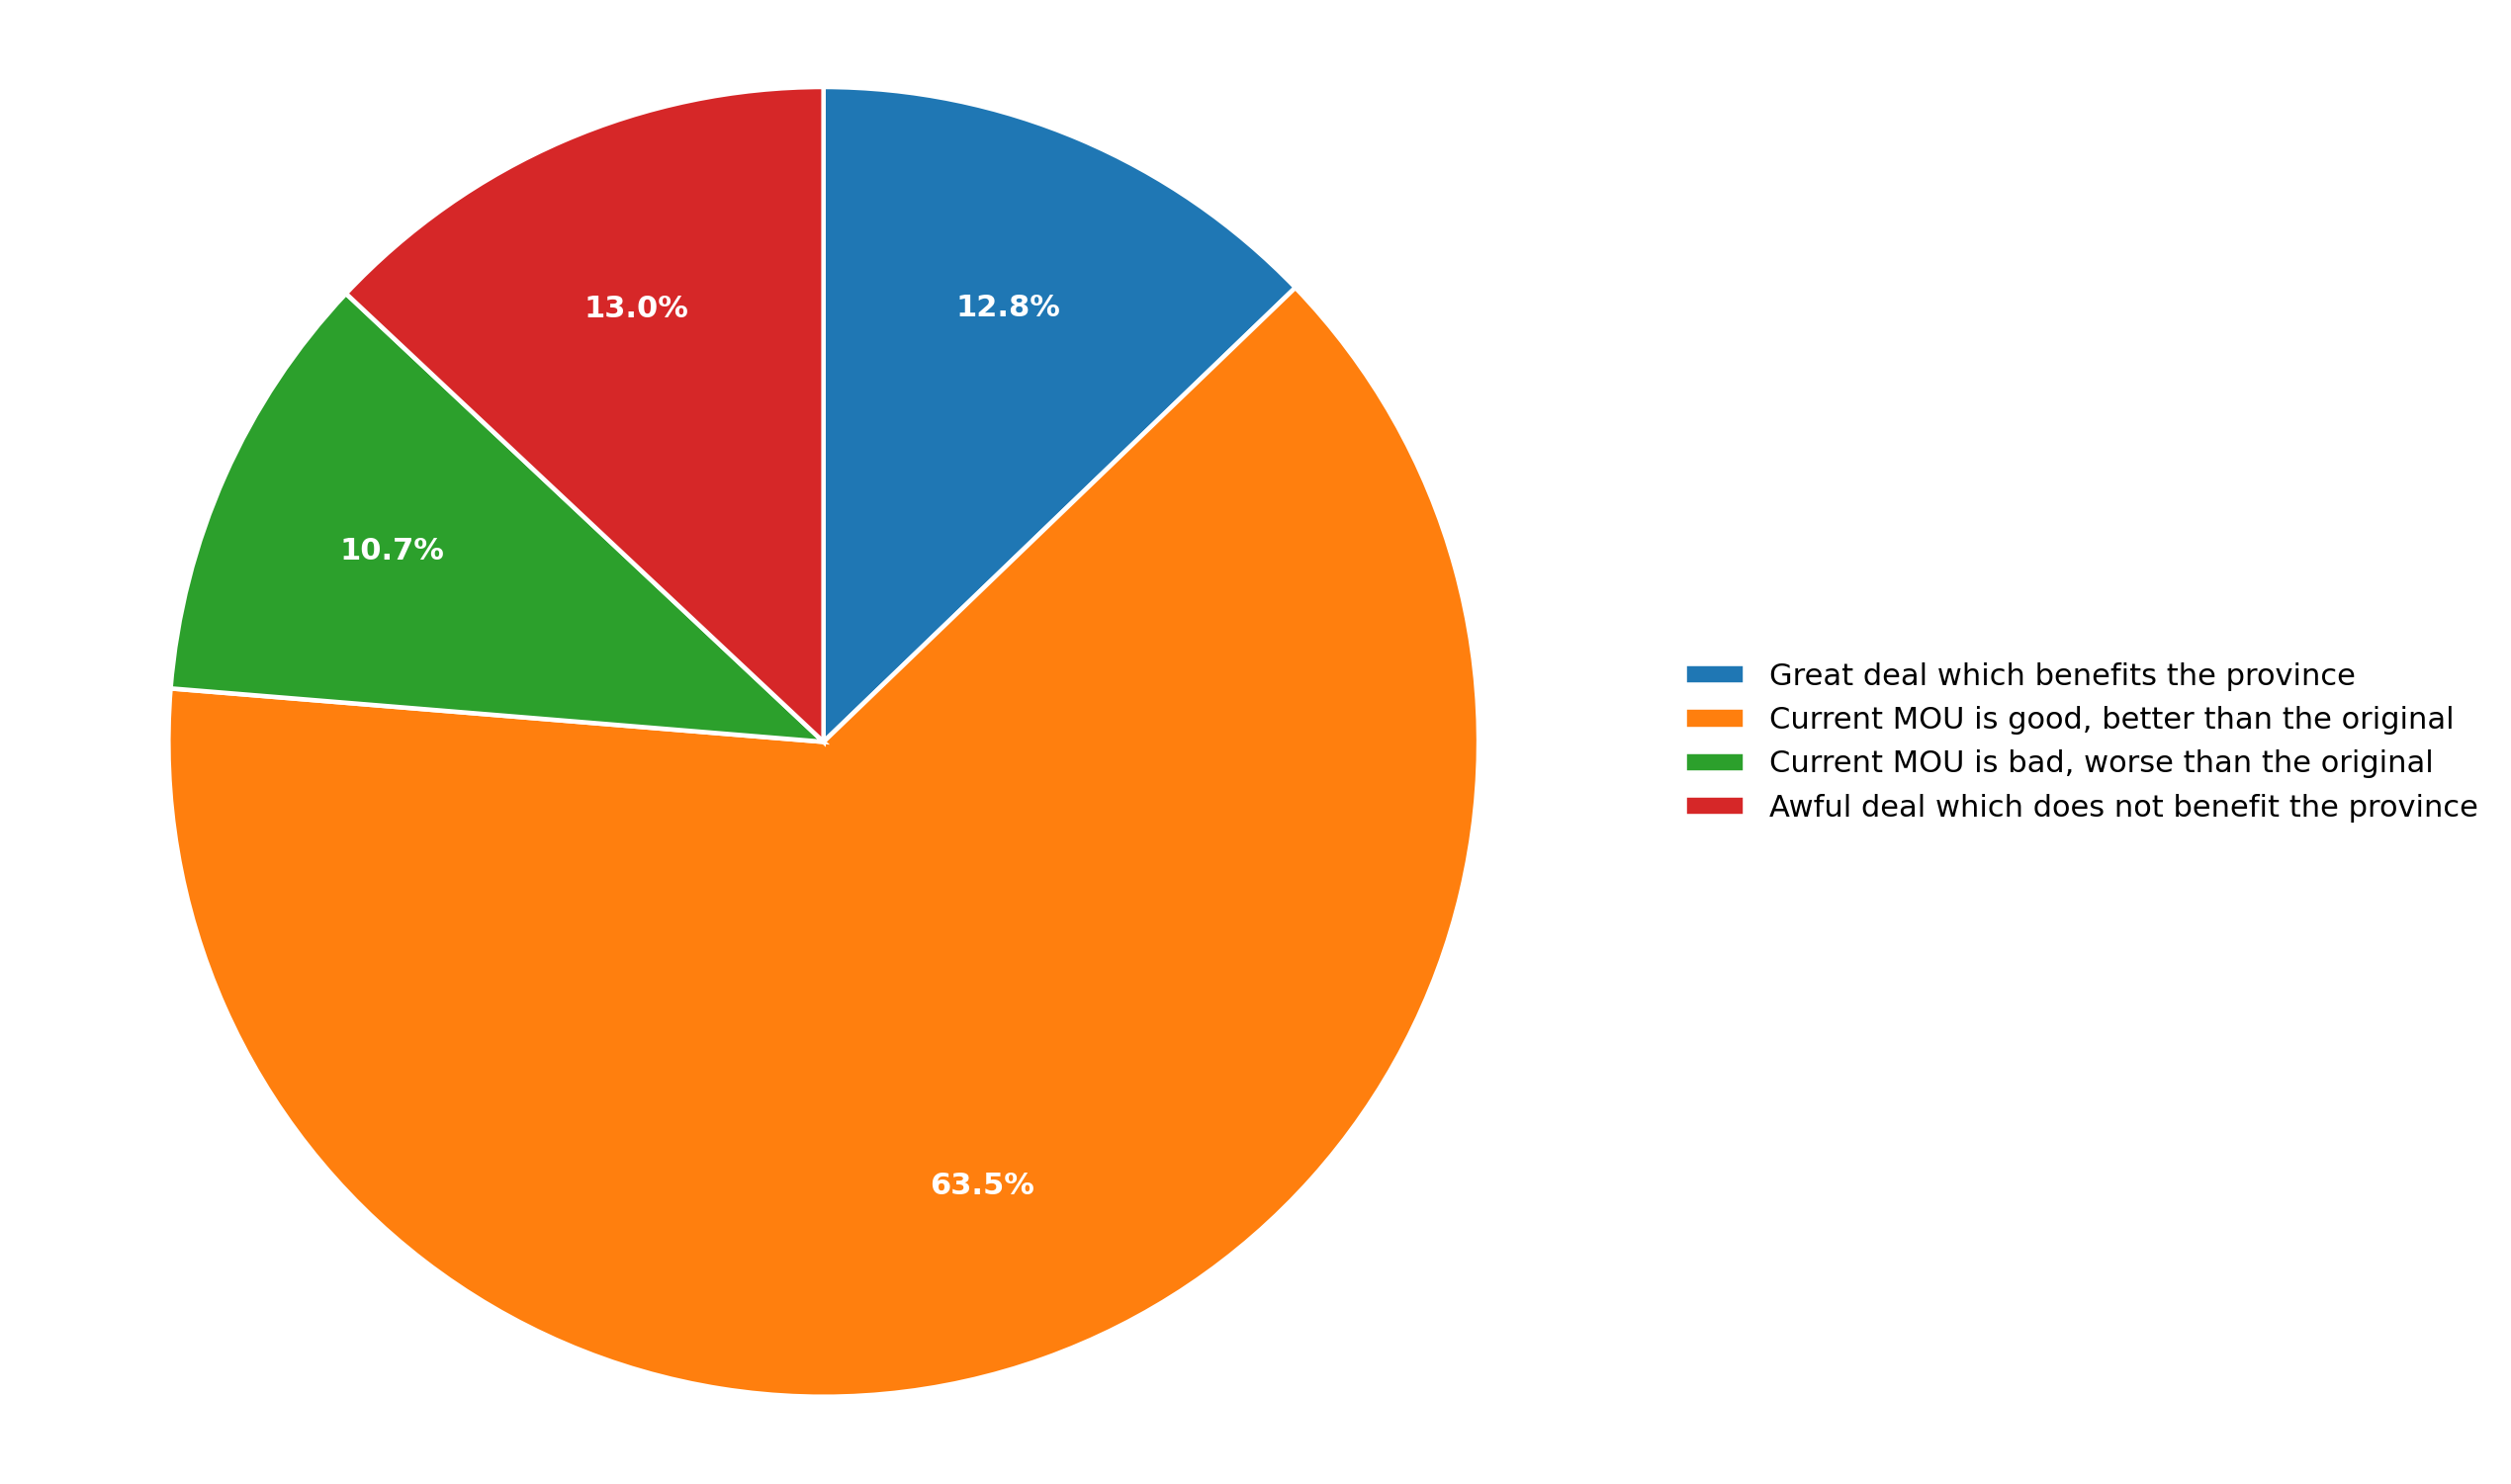
Unsurprisingly, among Progressive Conservative voters over three quarters approve of the deal, with most indicating they believe the deal is better than the prior MOU. PC voters also have the lowest level of negative feelings towards the deal out of all decided voters.
Decided Progressive Conservative Voters
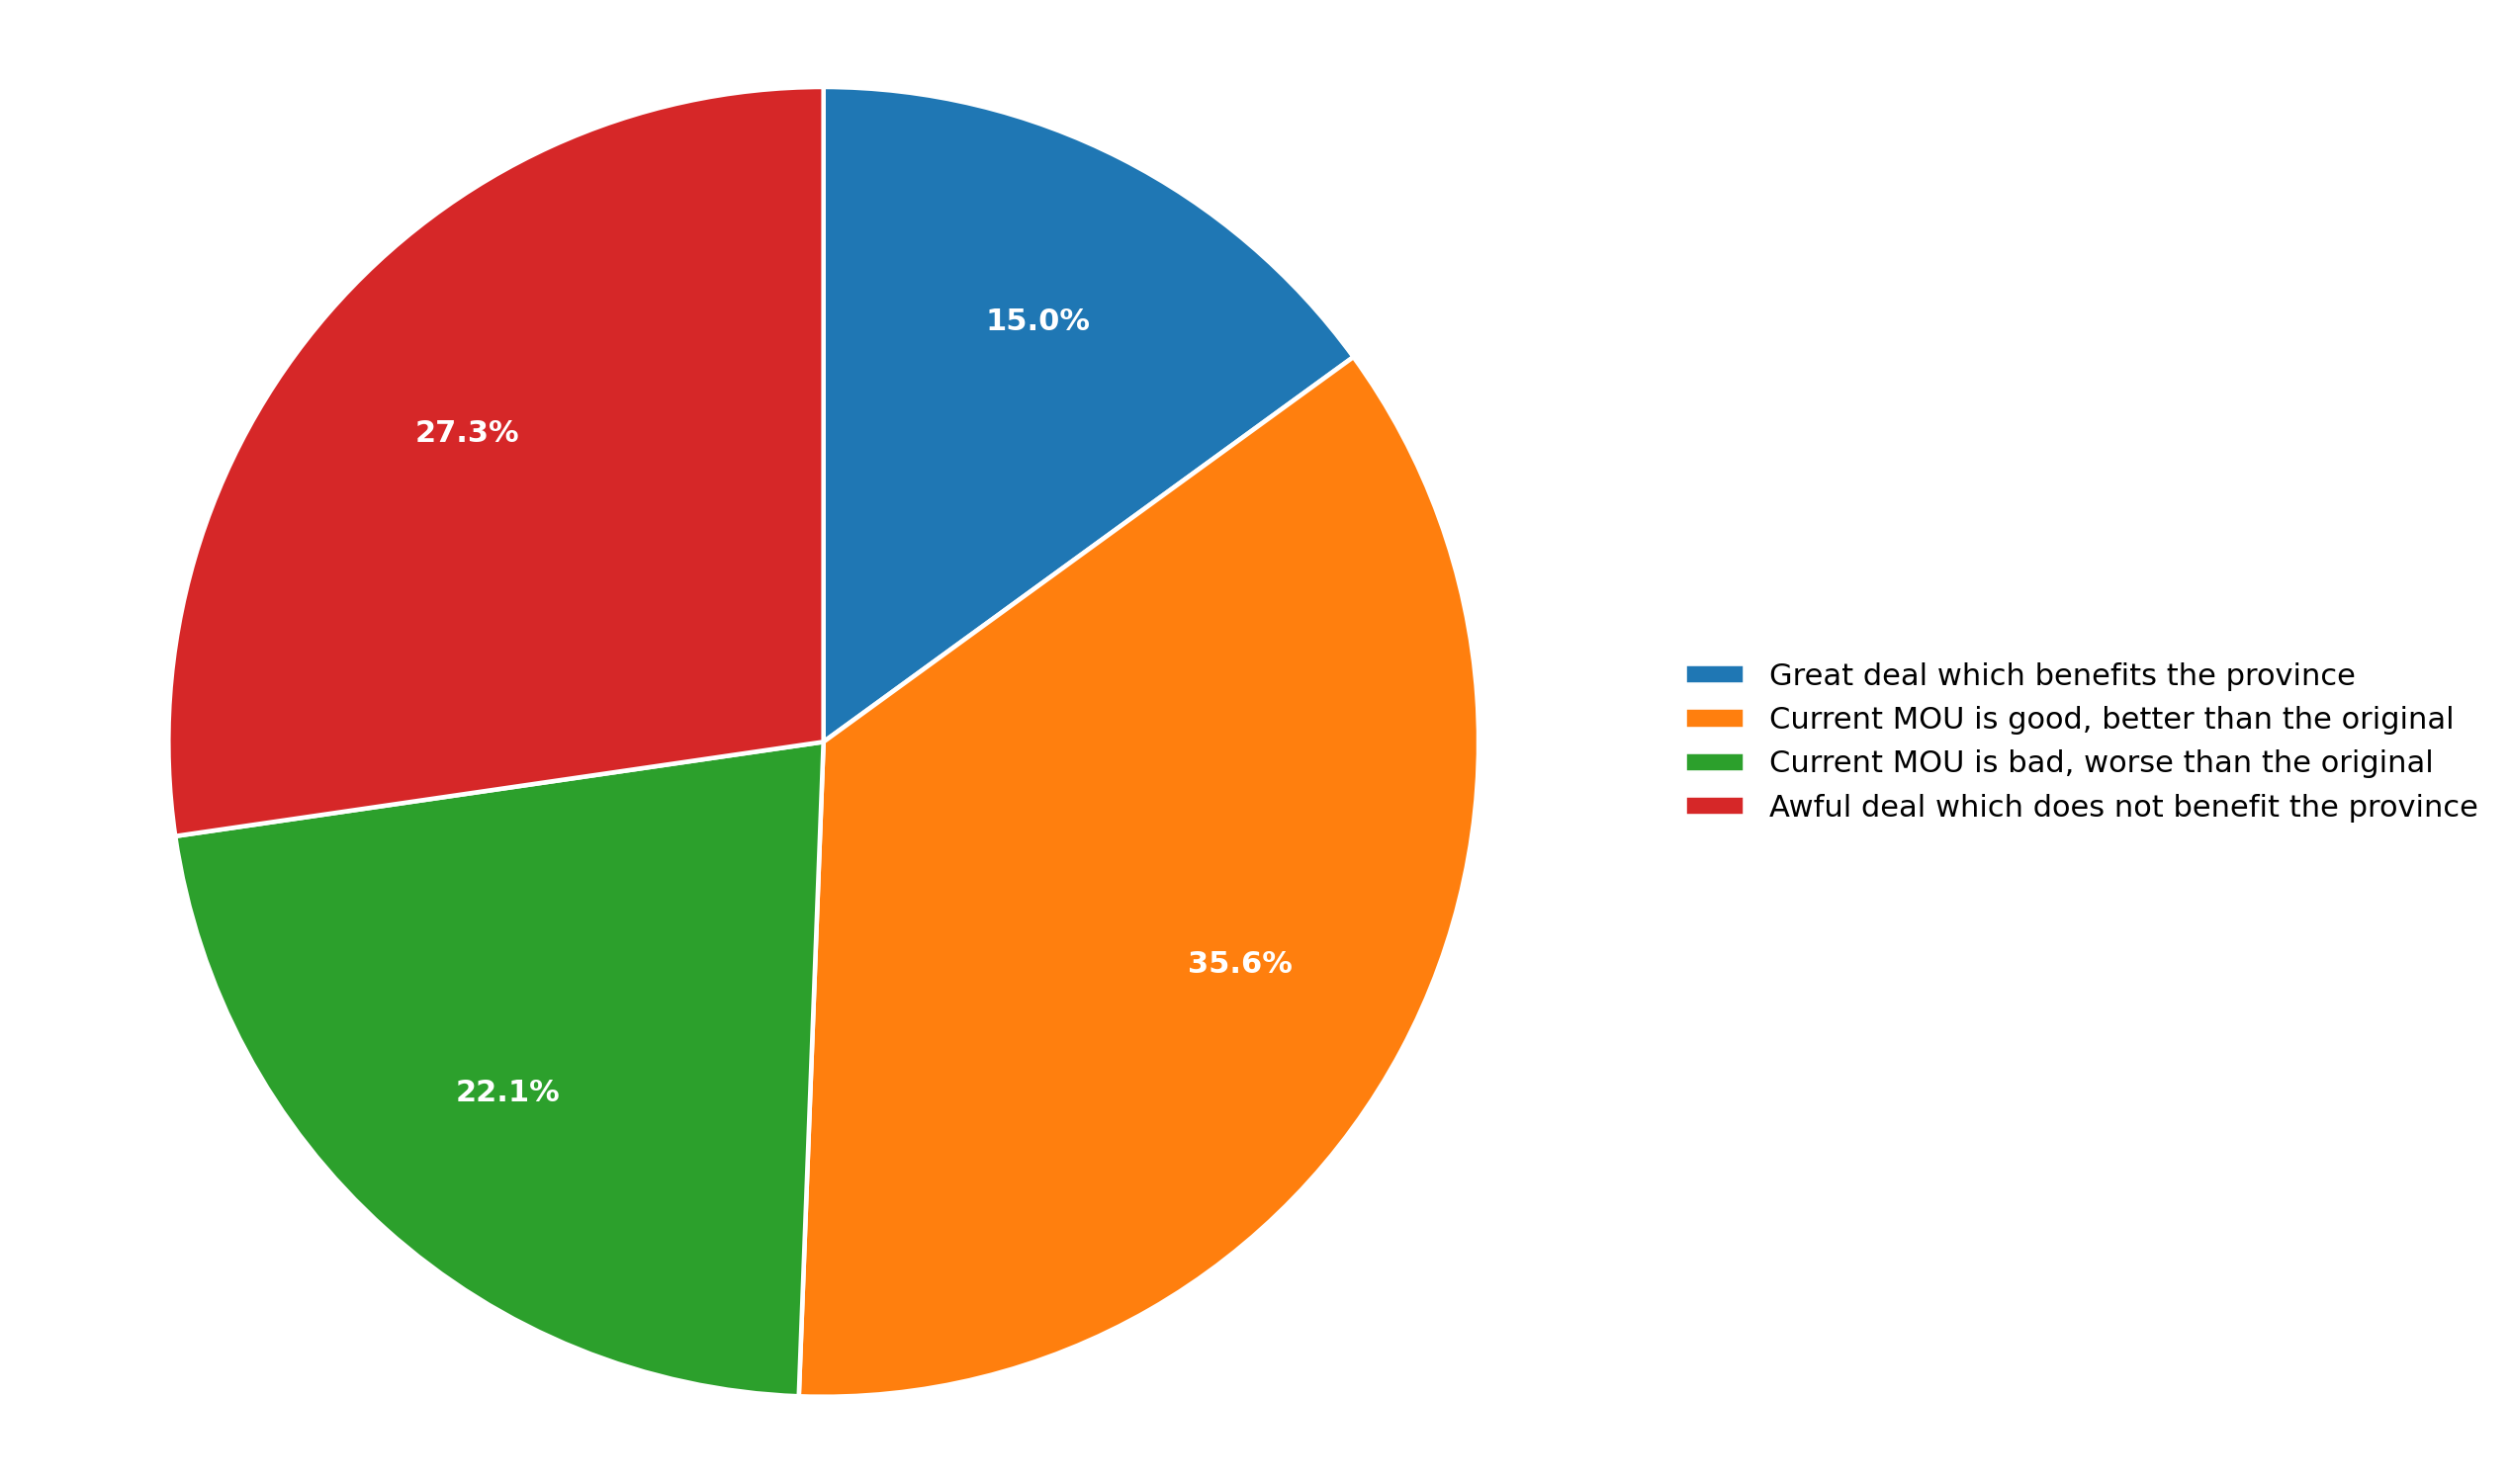
Maybe the most surprising result is from decided NDP voters. While there were many less decided NDP voters, and as such variablility of results can give strange results, NDP voters are essentially split on whether they like the MOU or not.
Decided NDP Voters
PART 2: Opinions on the Referendum on the MOU
Respondents were asked the following question:
Premier Tony Wakeham had promised a referendum on any new Churchill Falls deal, but has since walked back that promise in lieu of pushing ahead with the new MOU. How do you feel about a referendum on the Churchill Falls MOU?
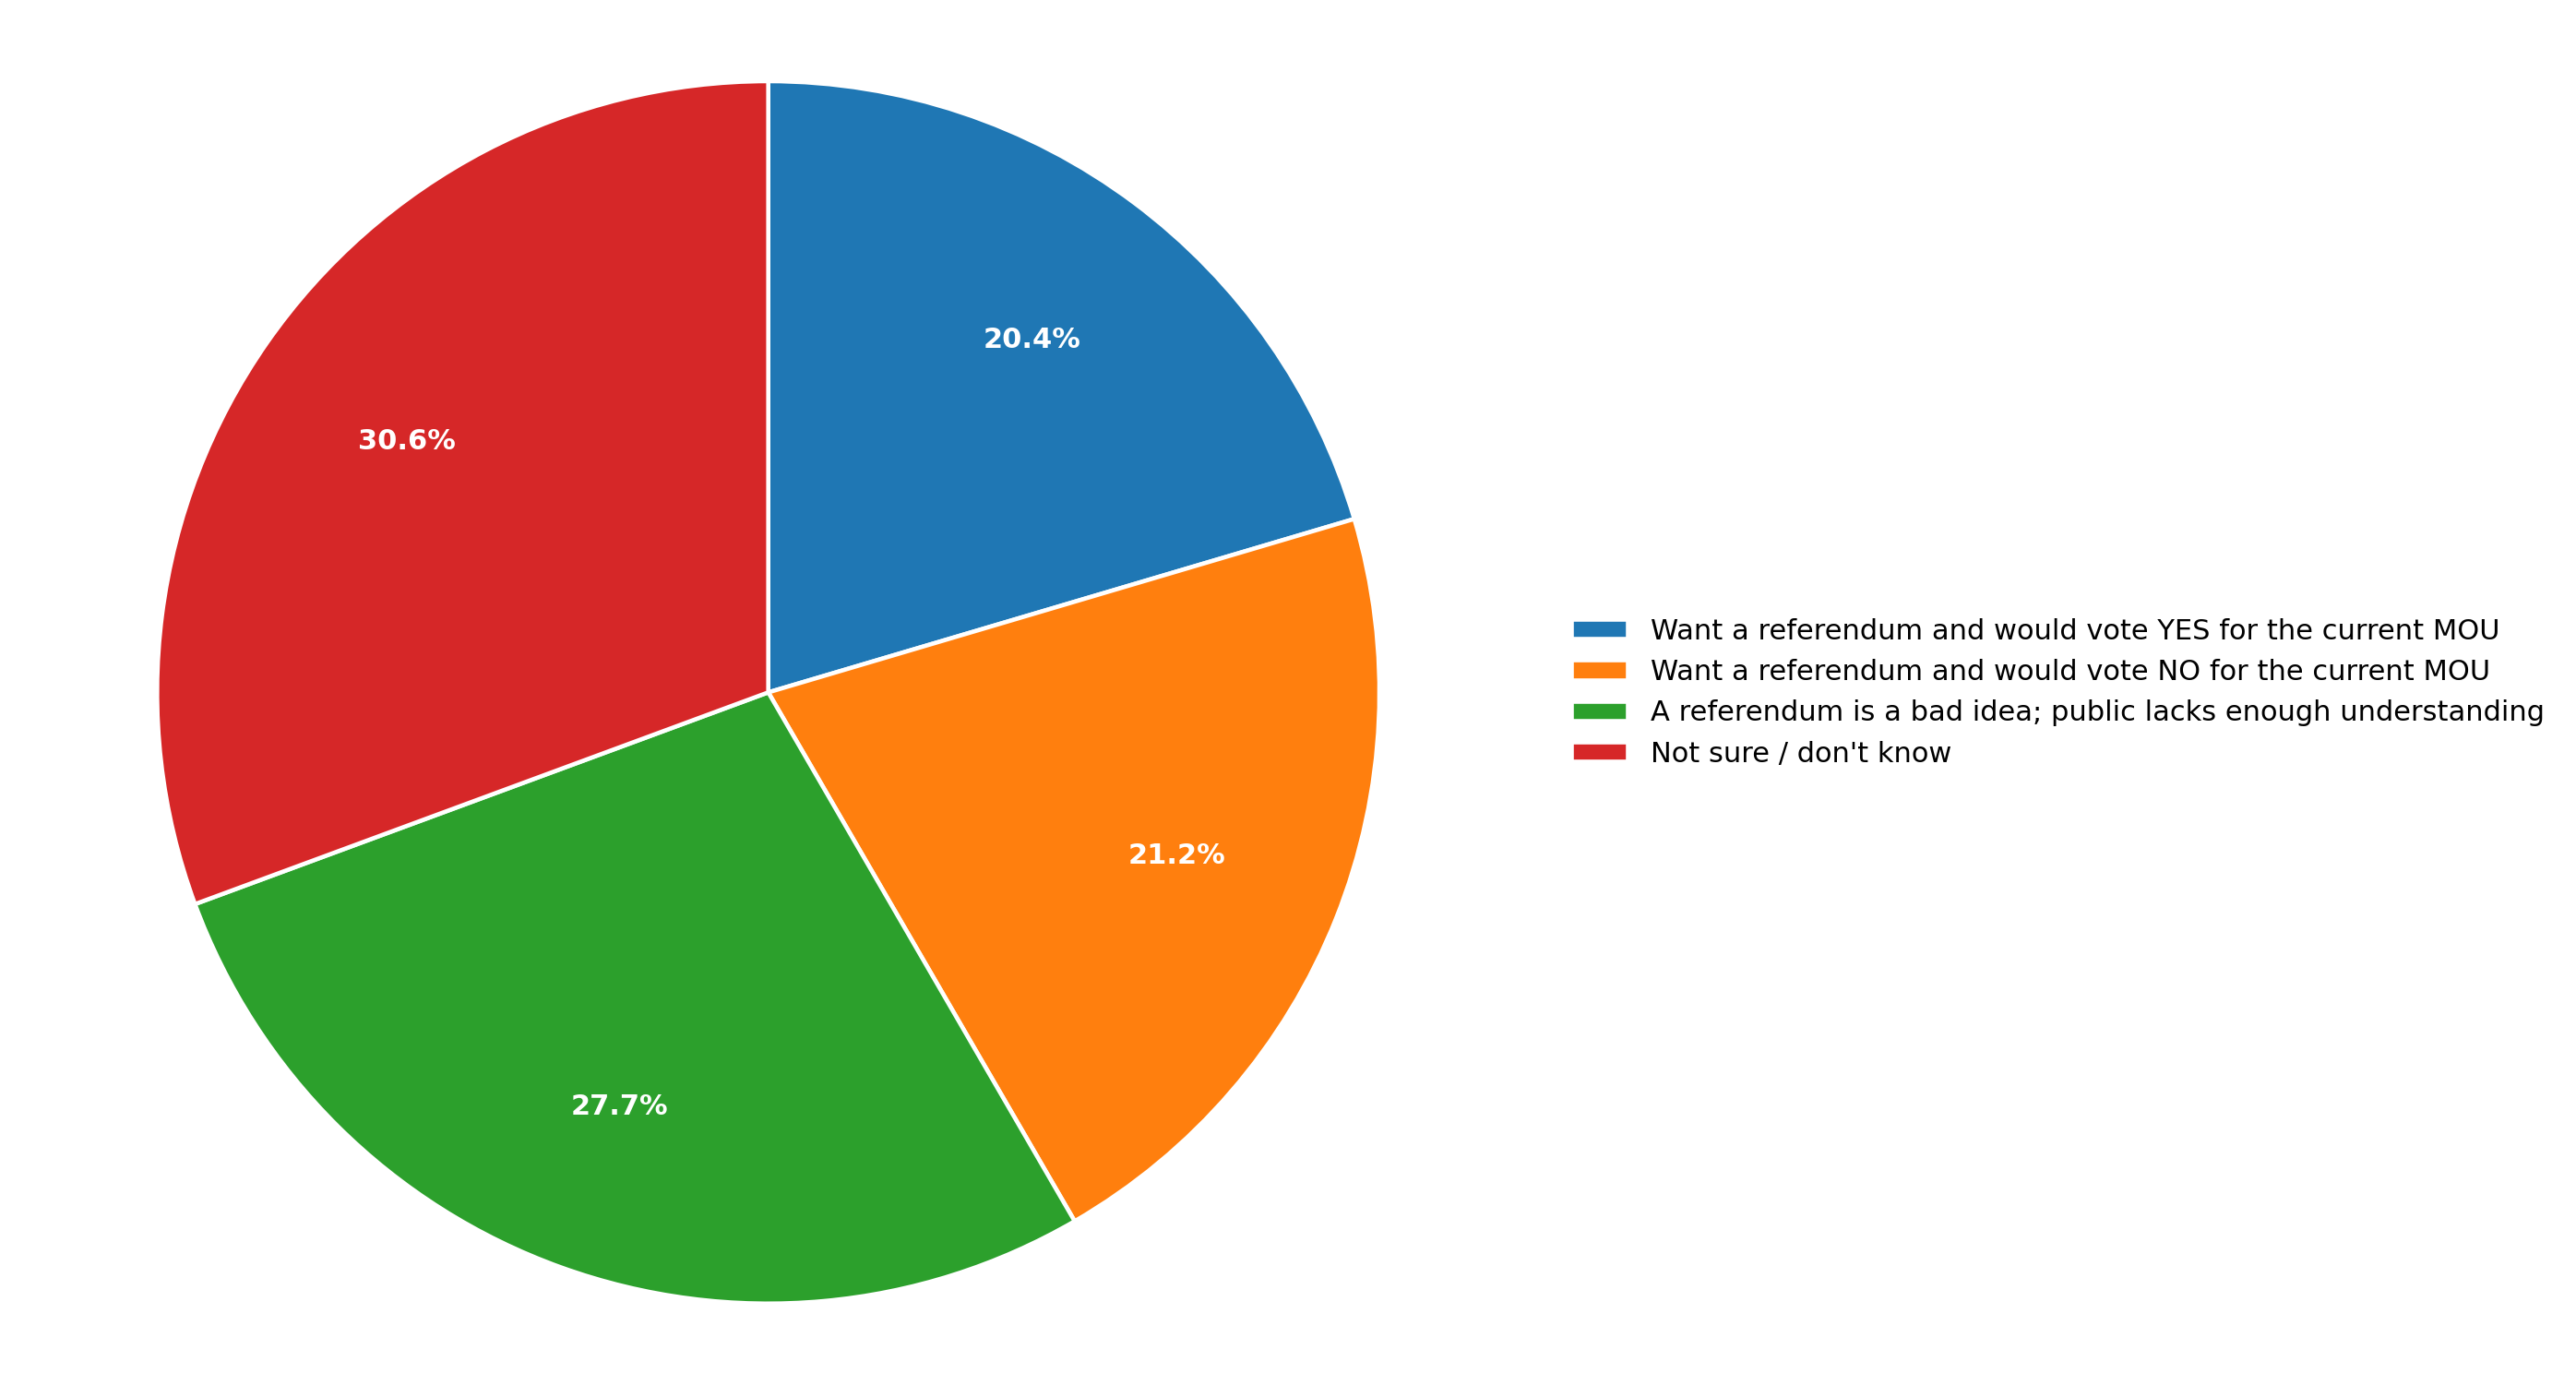
Opinions on the referendum promised by Premier Tony Wakeham during the 2025 election campaign are quite a bit varied. Once again, the vast majority of respondents do not know how to feel about a referendum, which again is a fair response to a complex topic.
Among respondents with an opinion on the referendum, most respondents responded that the referendum would be a bad idea as the general public is not informed enough to make a sound decision on a complex deal like the MOU. More interesting though is that 60% of respondents want a referendum in some manner. However, those who want a referendum are almost evenly split about whether they would vote YES or NO for the deal.
Referendum Opinion based on Vote Intention
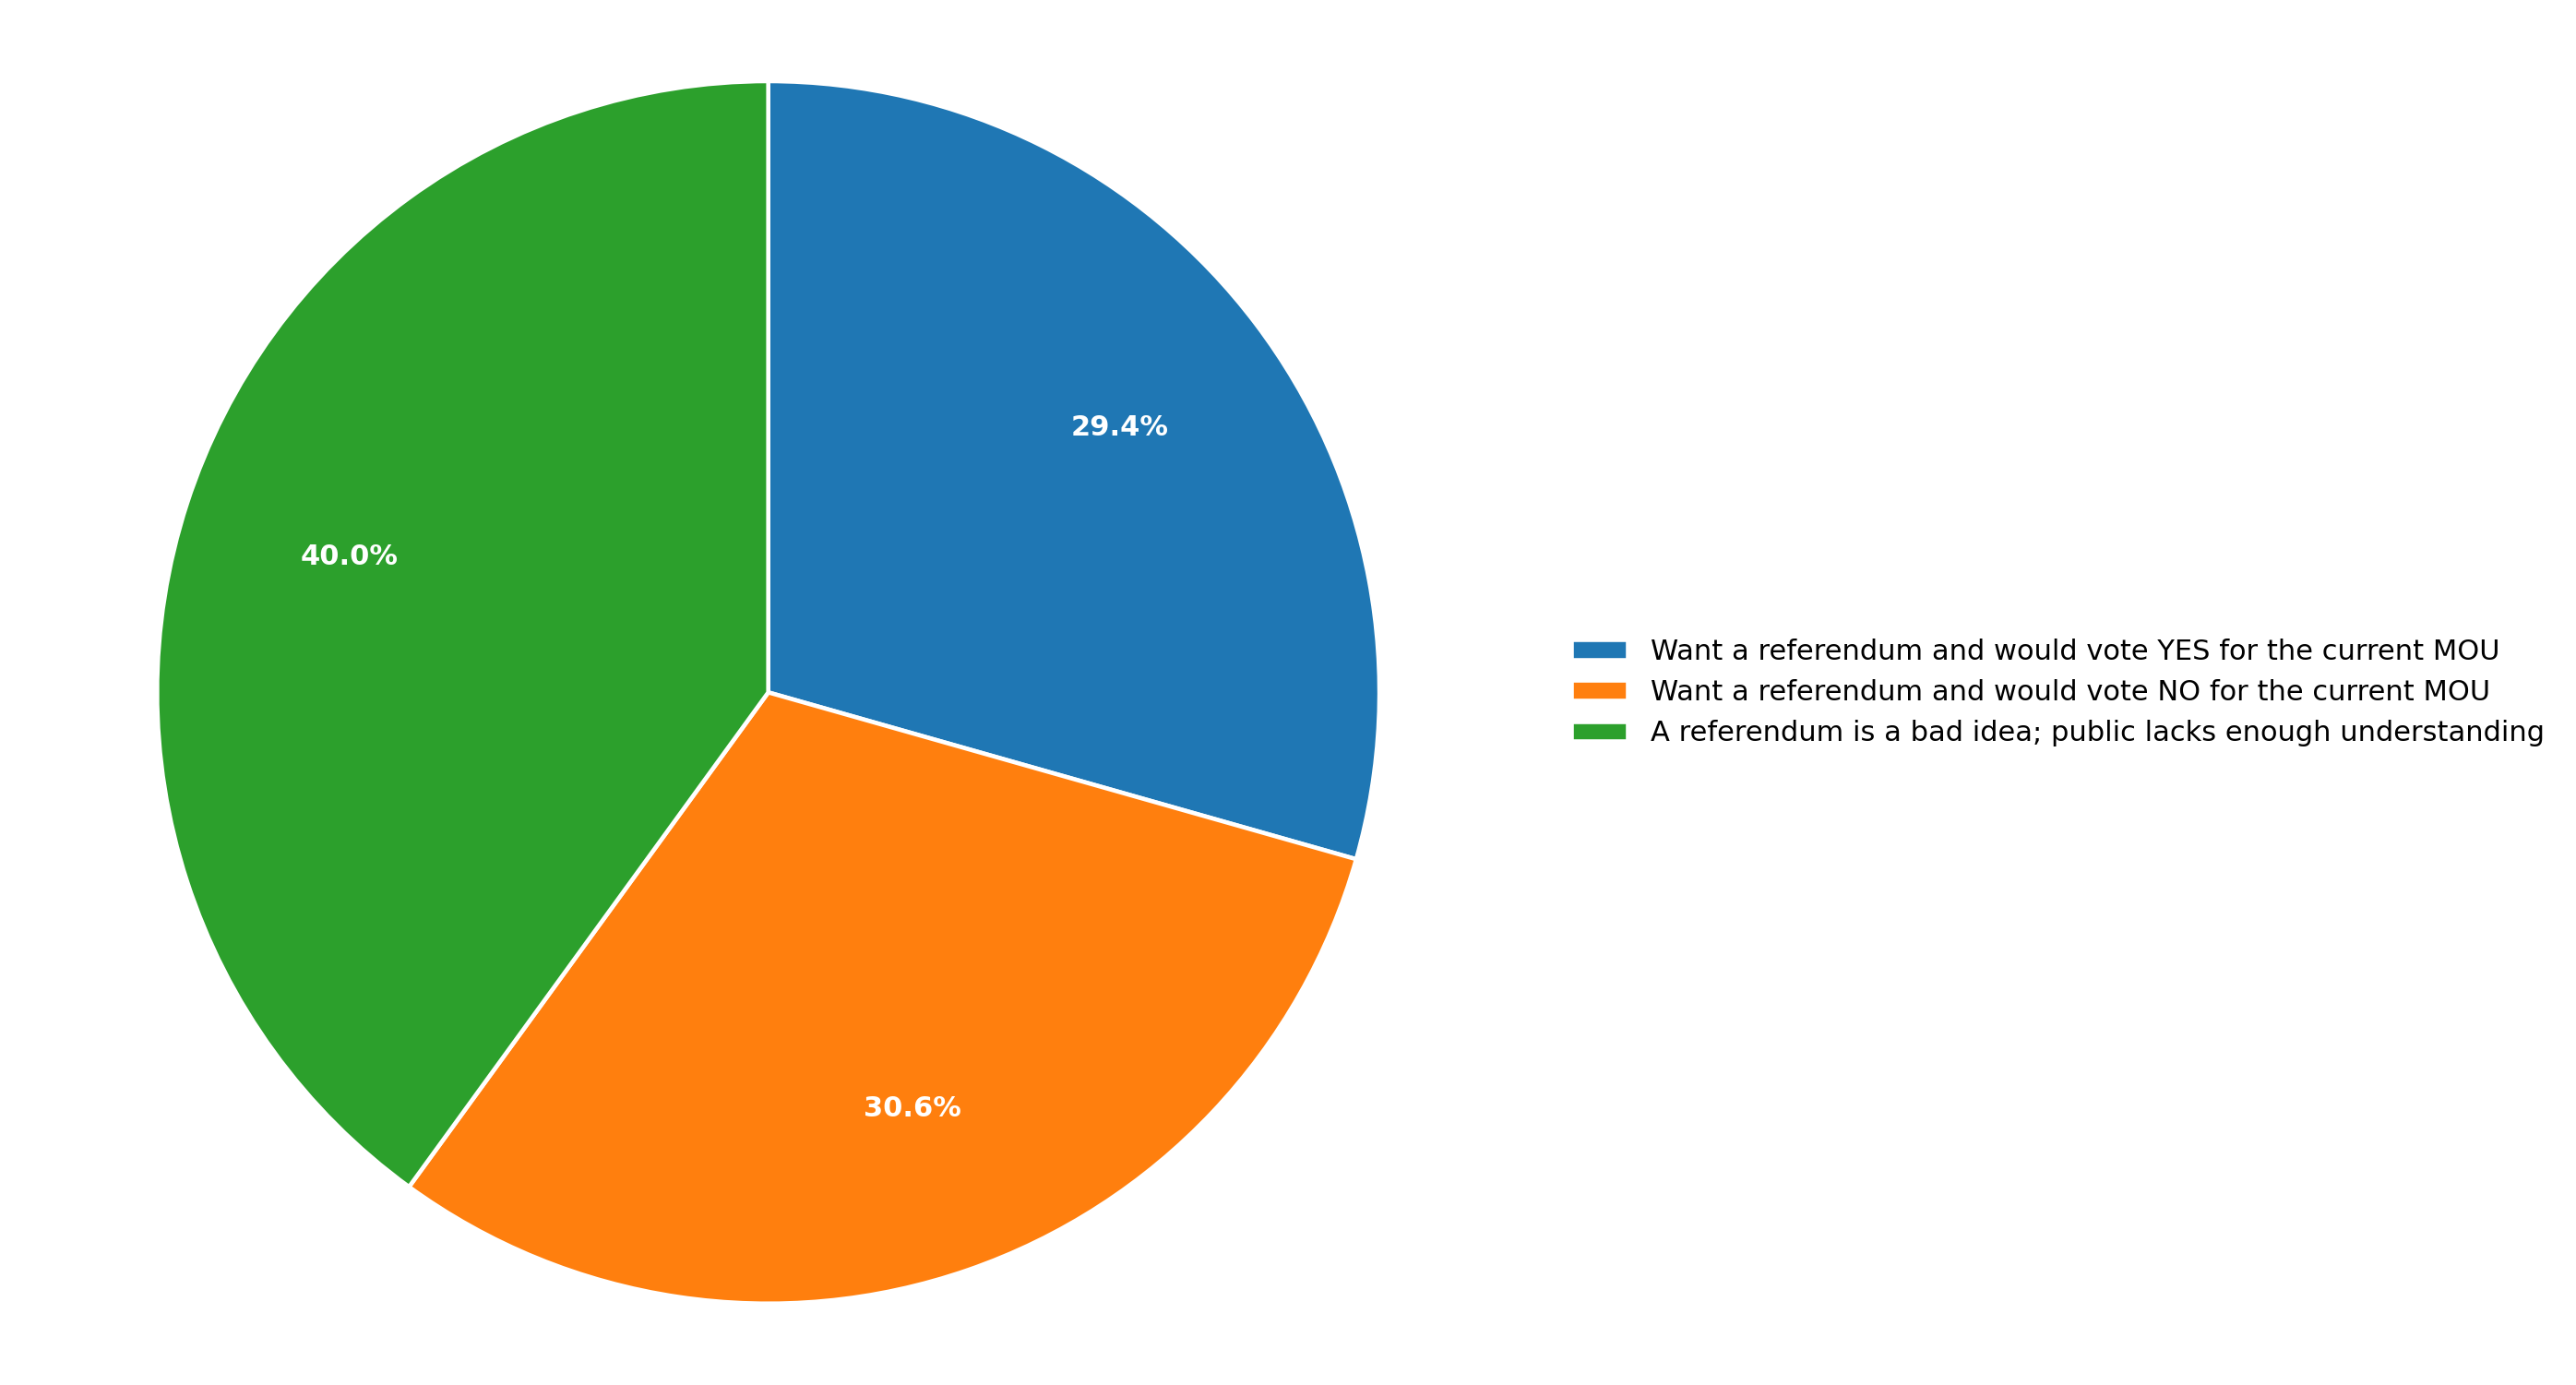
Opinions on whether there should be a referendum, and how one would vote in a referendum are vastly different depending on vote intention. Despite 66% of decided Liberal voters saying the MOU is a good or great deal, nearly 37% of decided Liberal voters would still vote NO in a referendum, while 30% would vote yes, and 34% believe a referendum is a bad idea.
Decided Liberal Voters
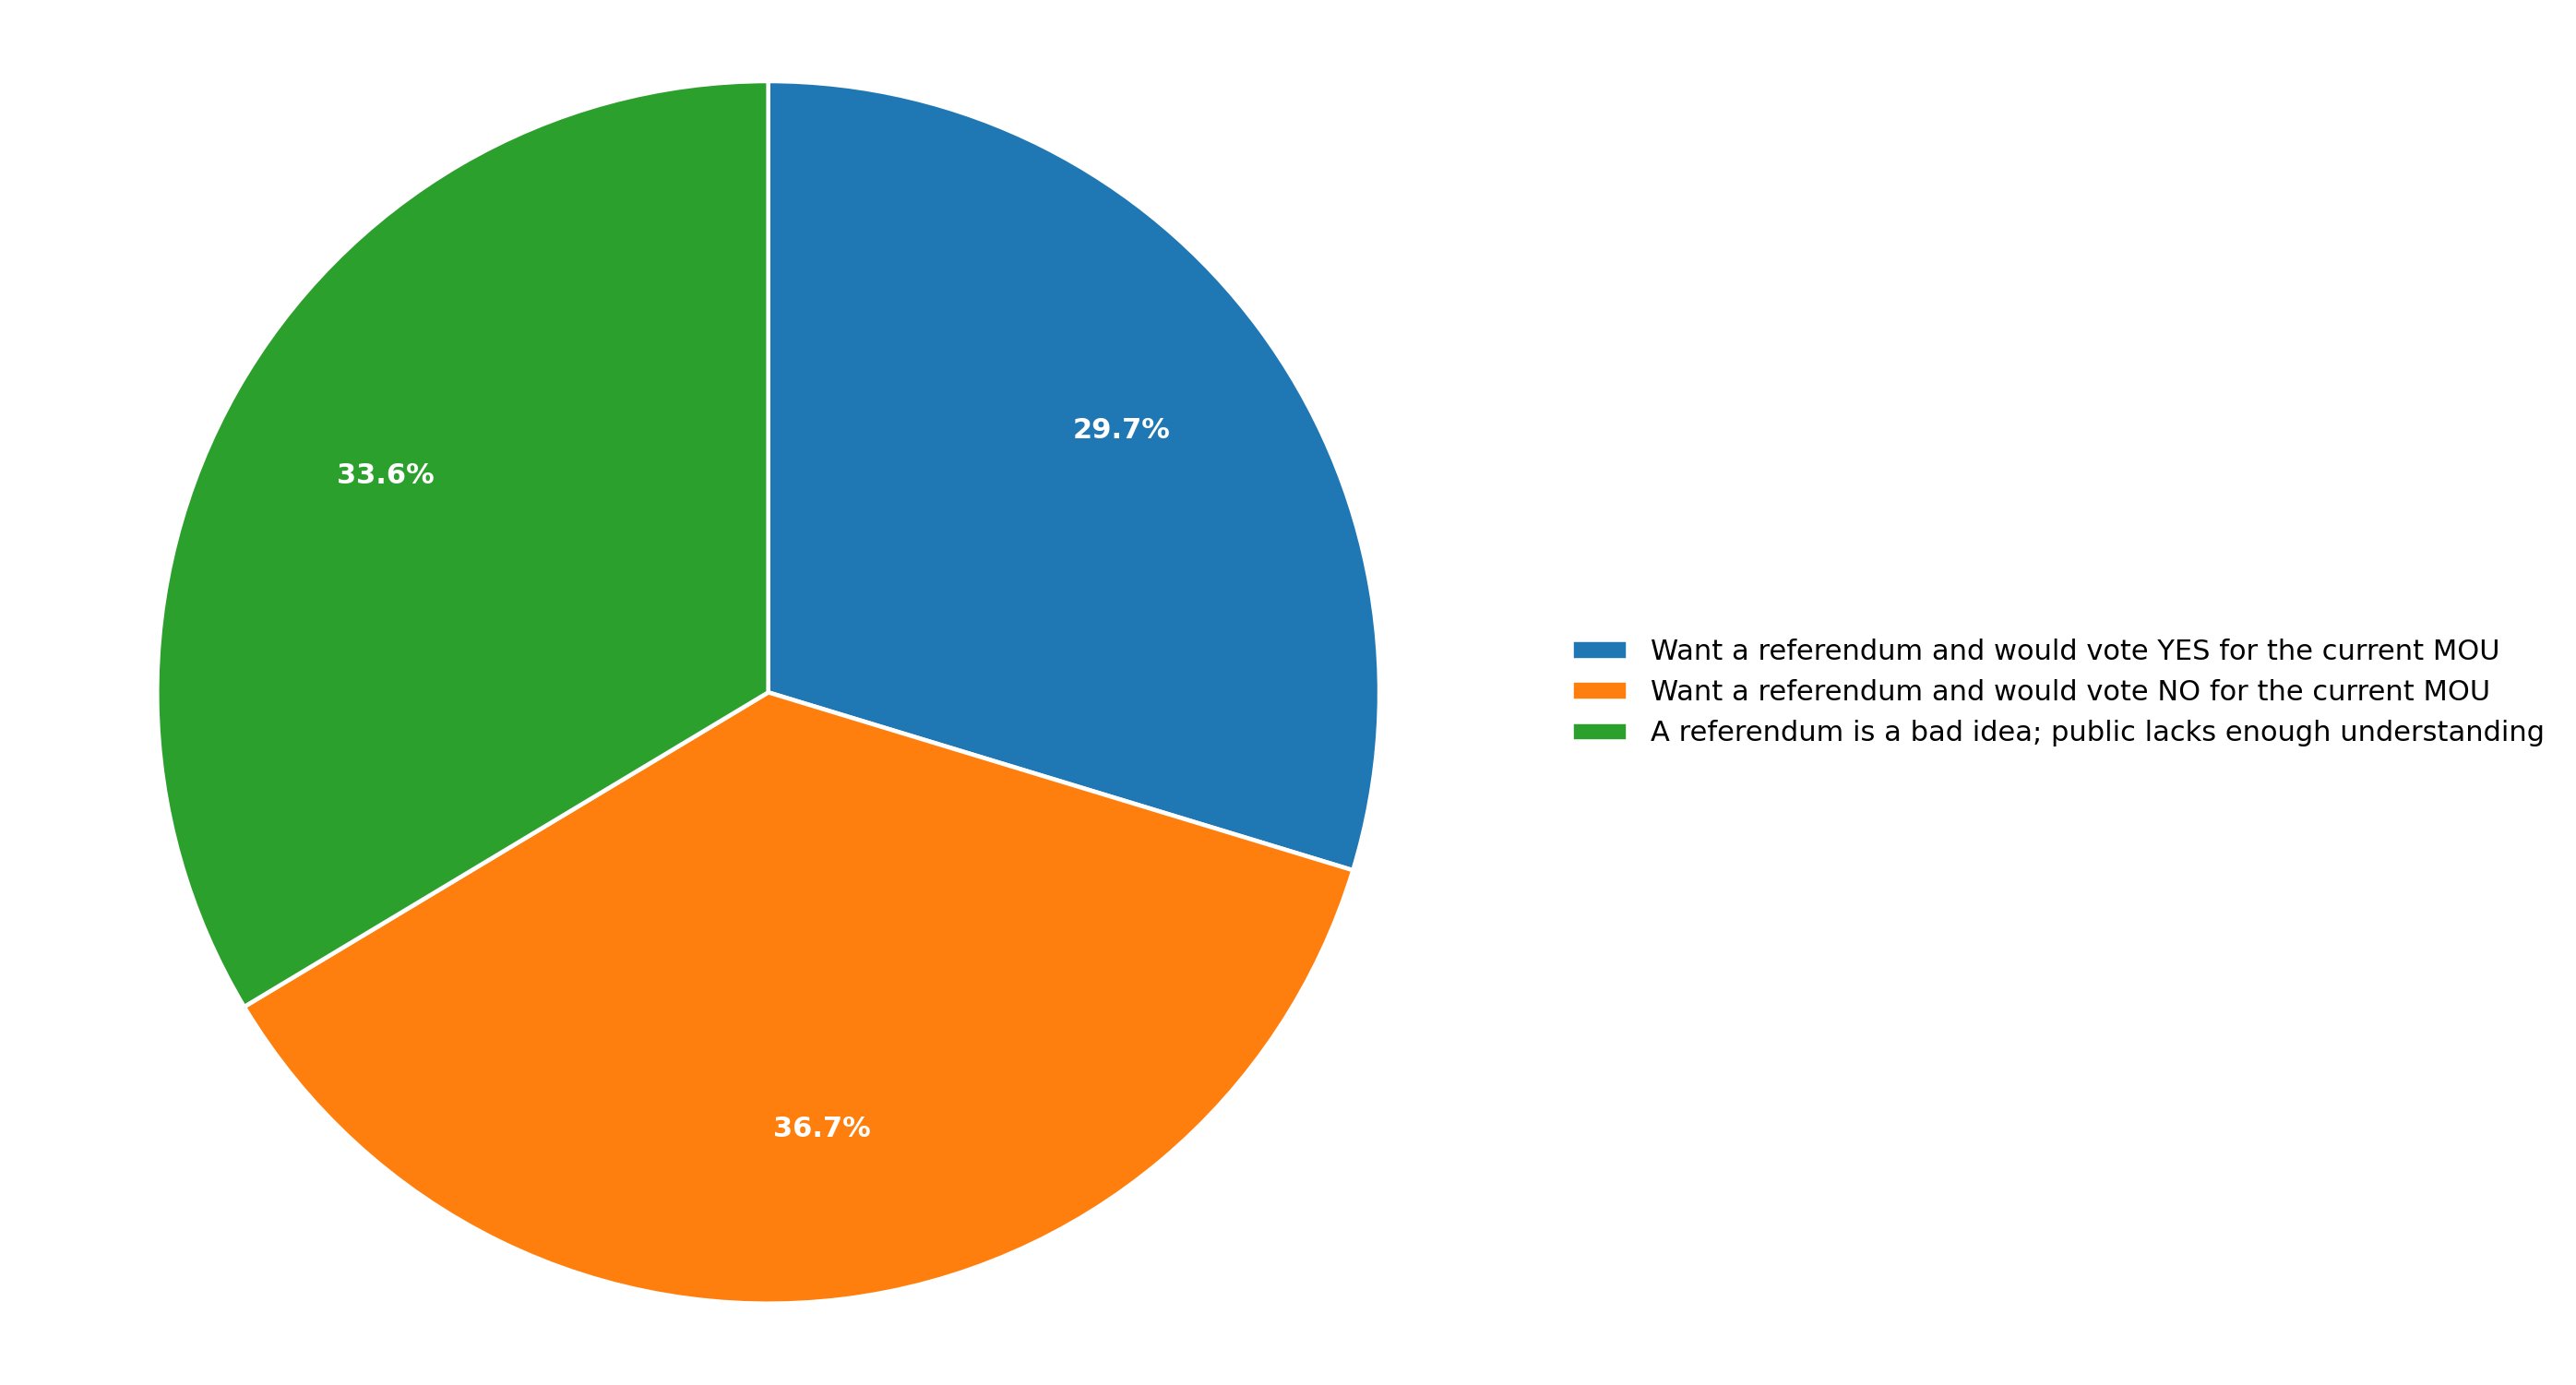
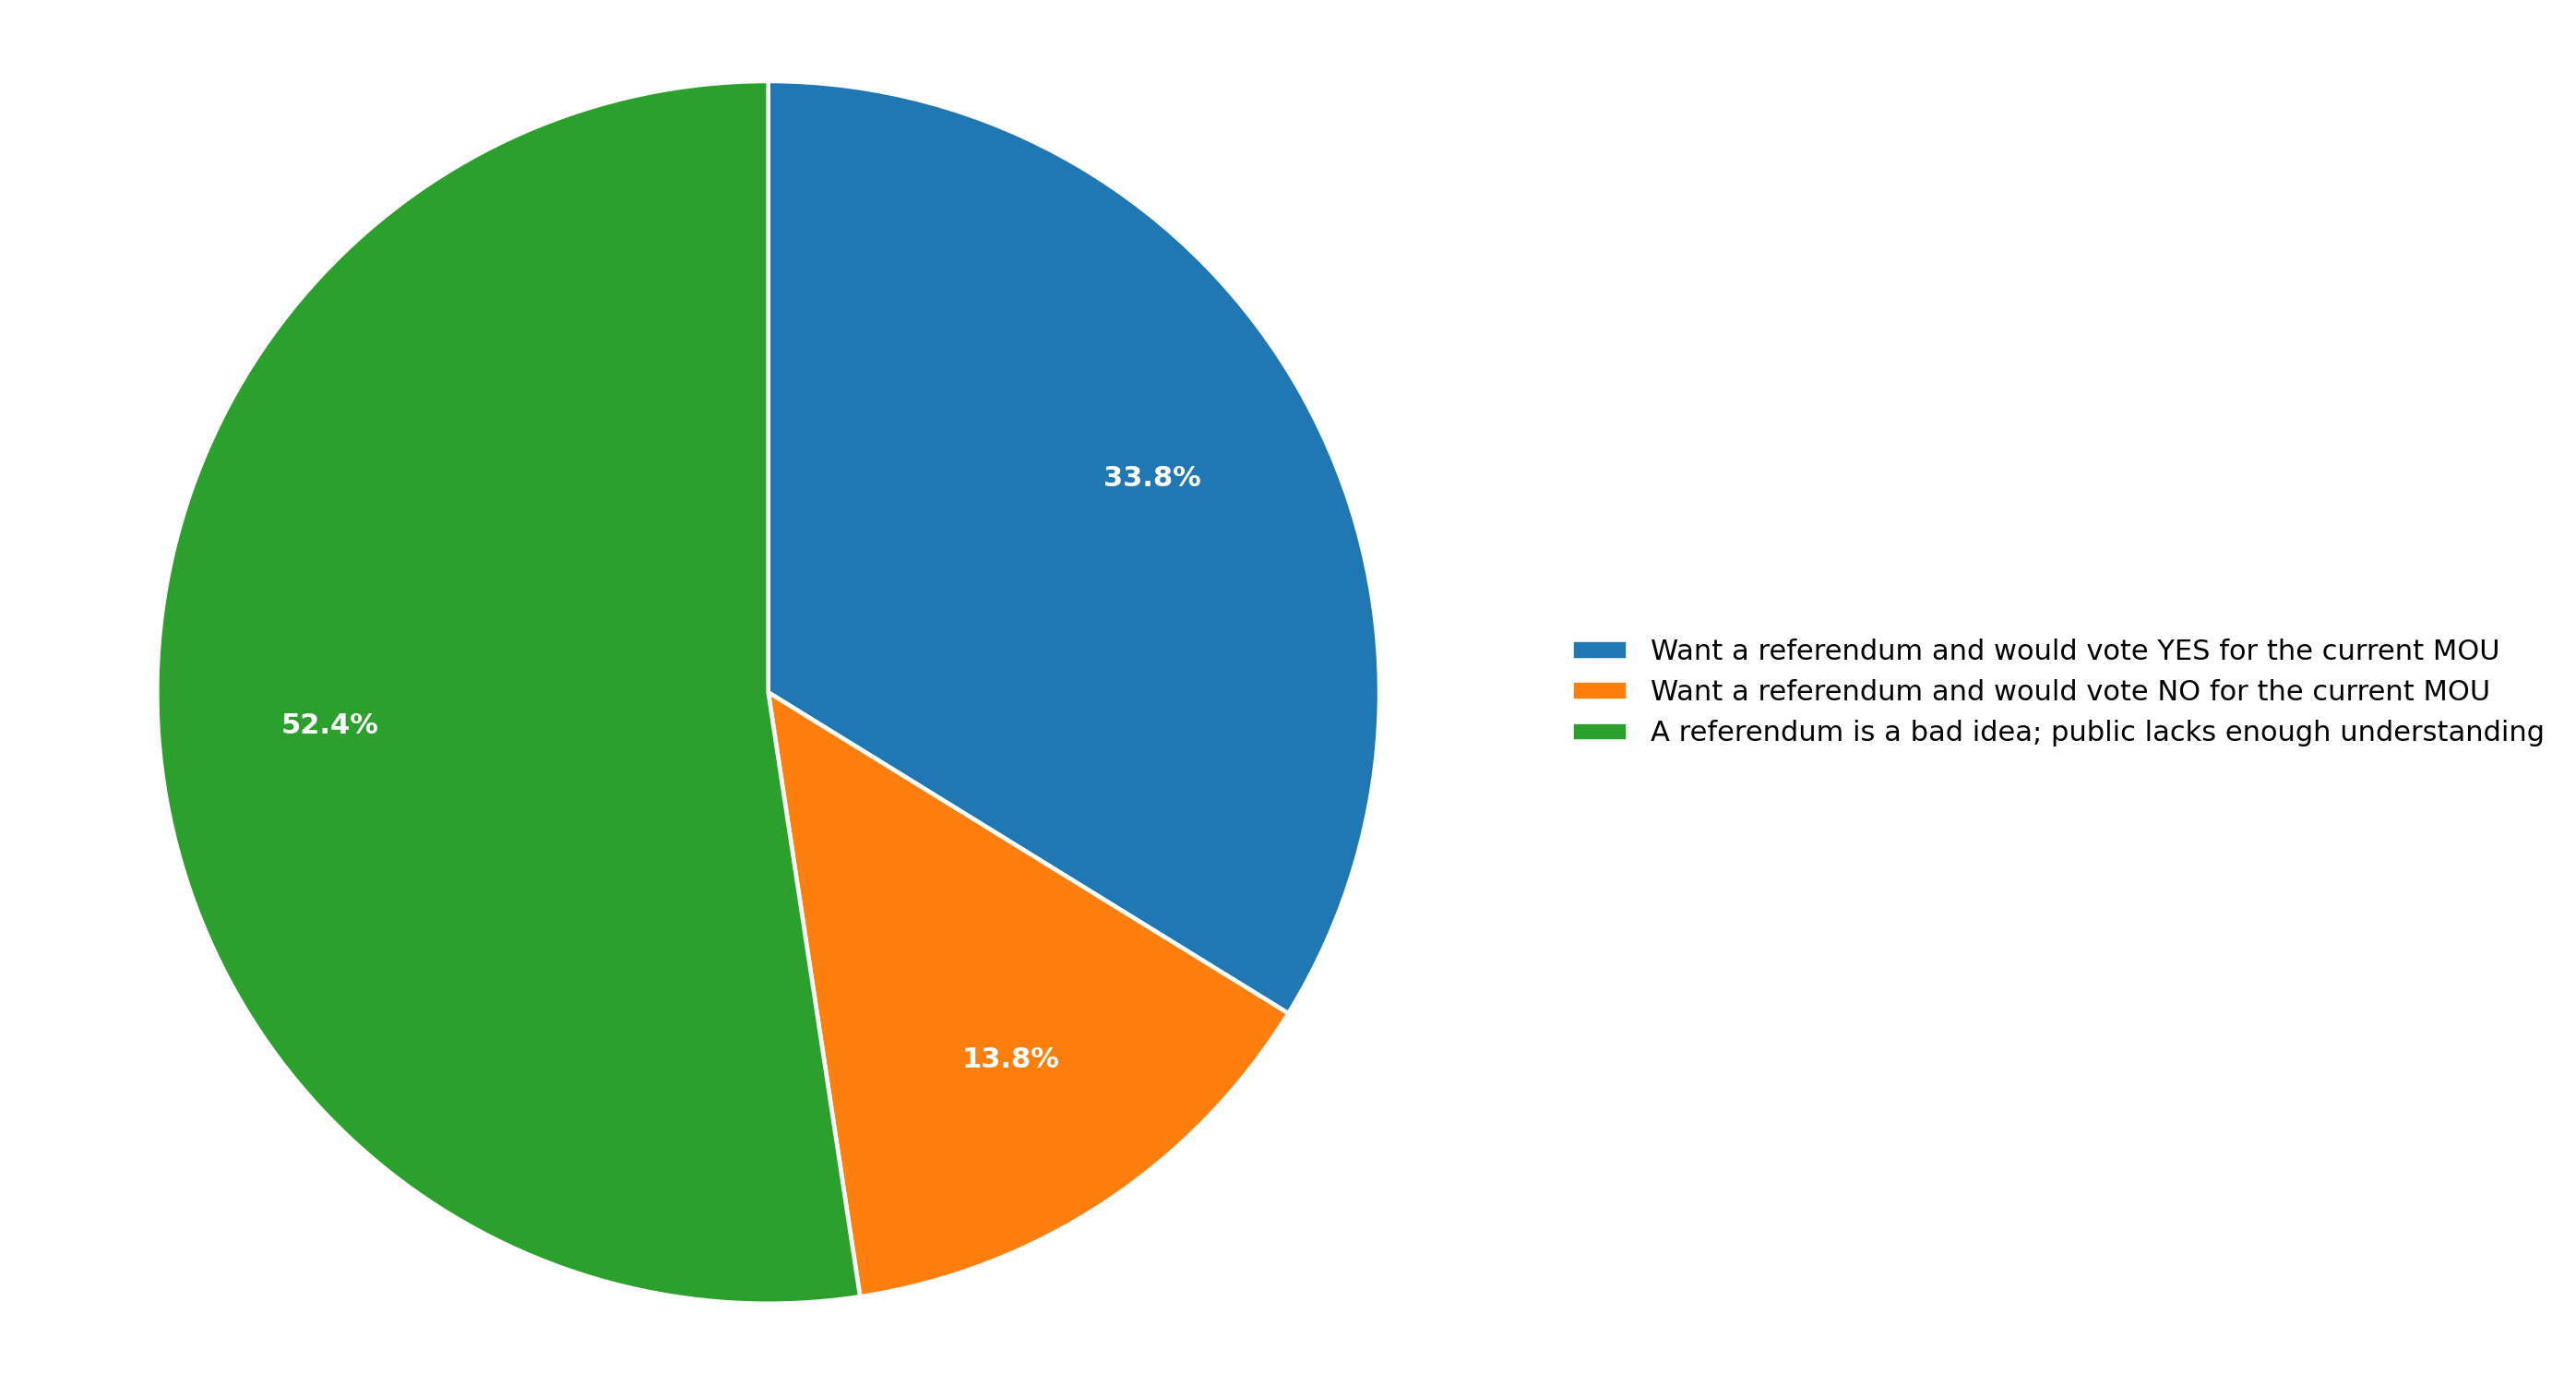
The majority of decided PC voters believe a referendum is a bad idea, while only 14% of decided PC voters would vote NO in a referendum, which does seem to indicate that current PC voters don't appear to be too upset about Wakeham flip-flopping on his election promise.
Decided Progressive Conservartive Voters
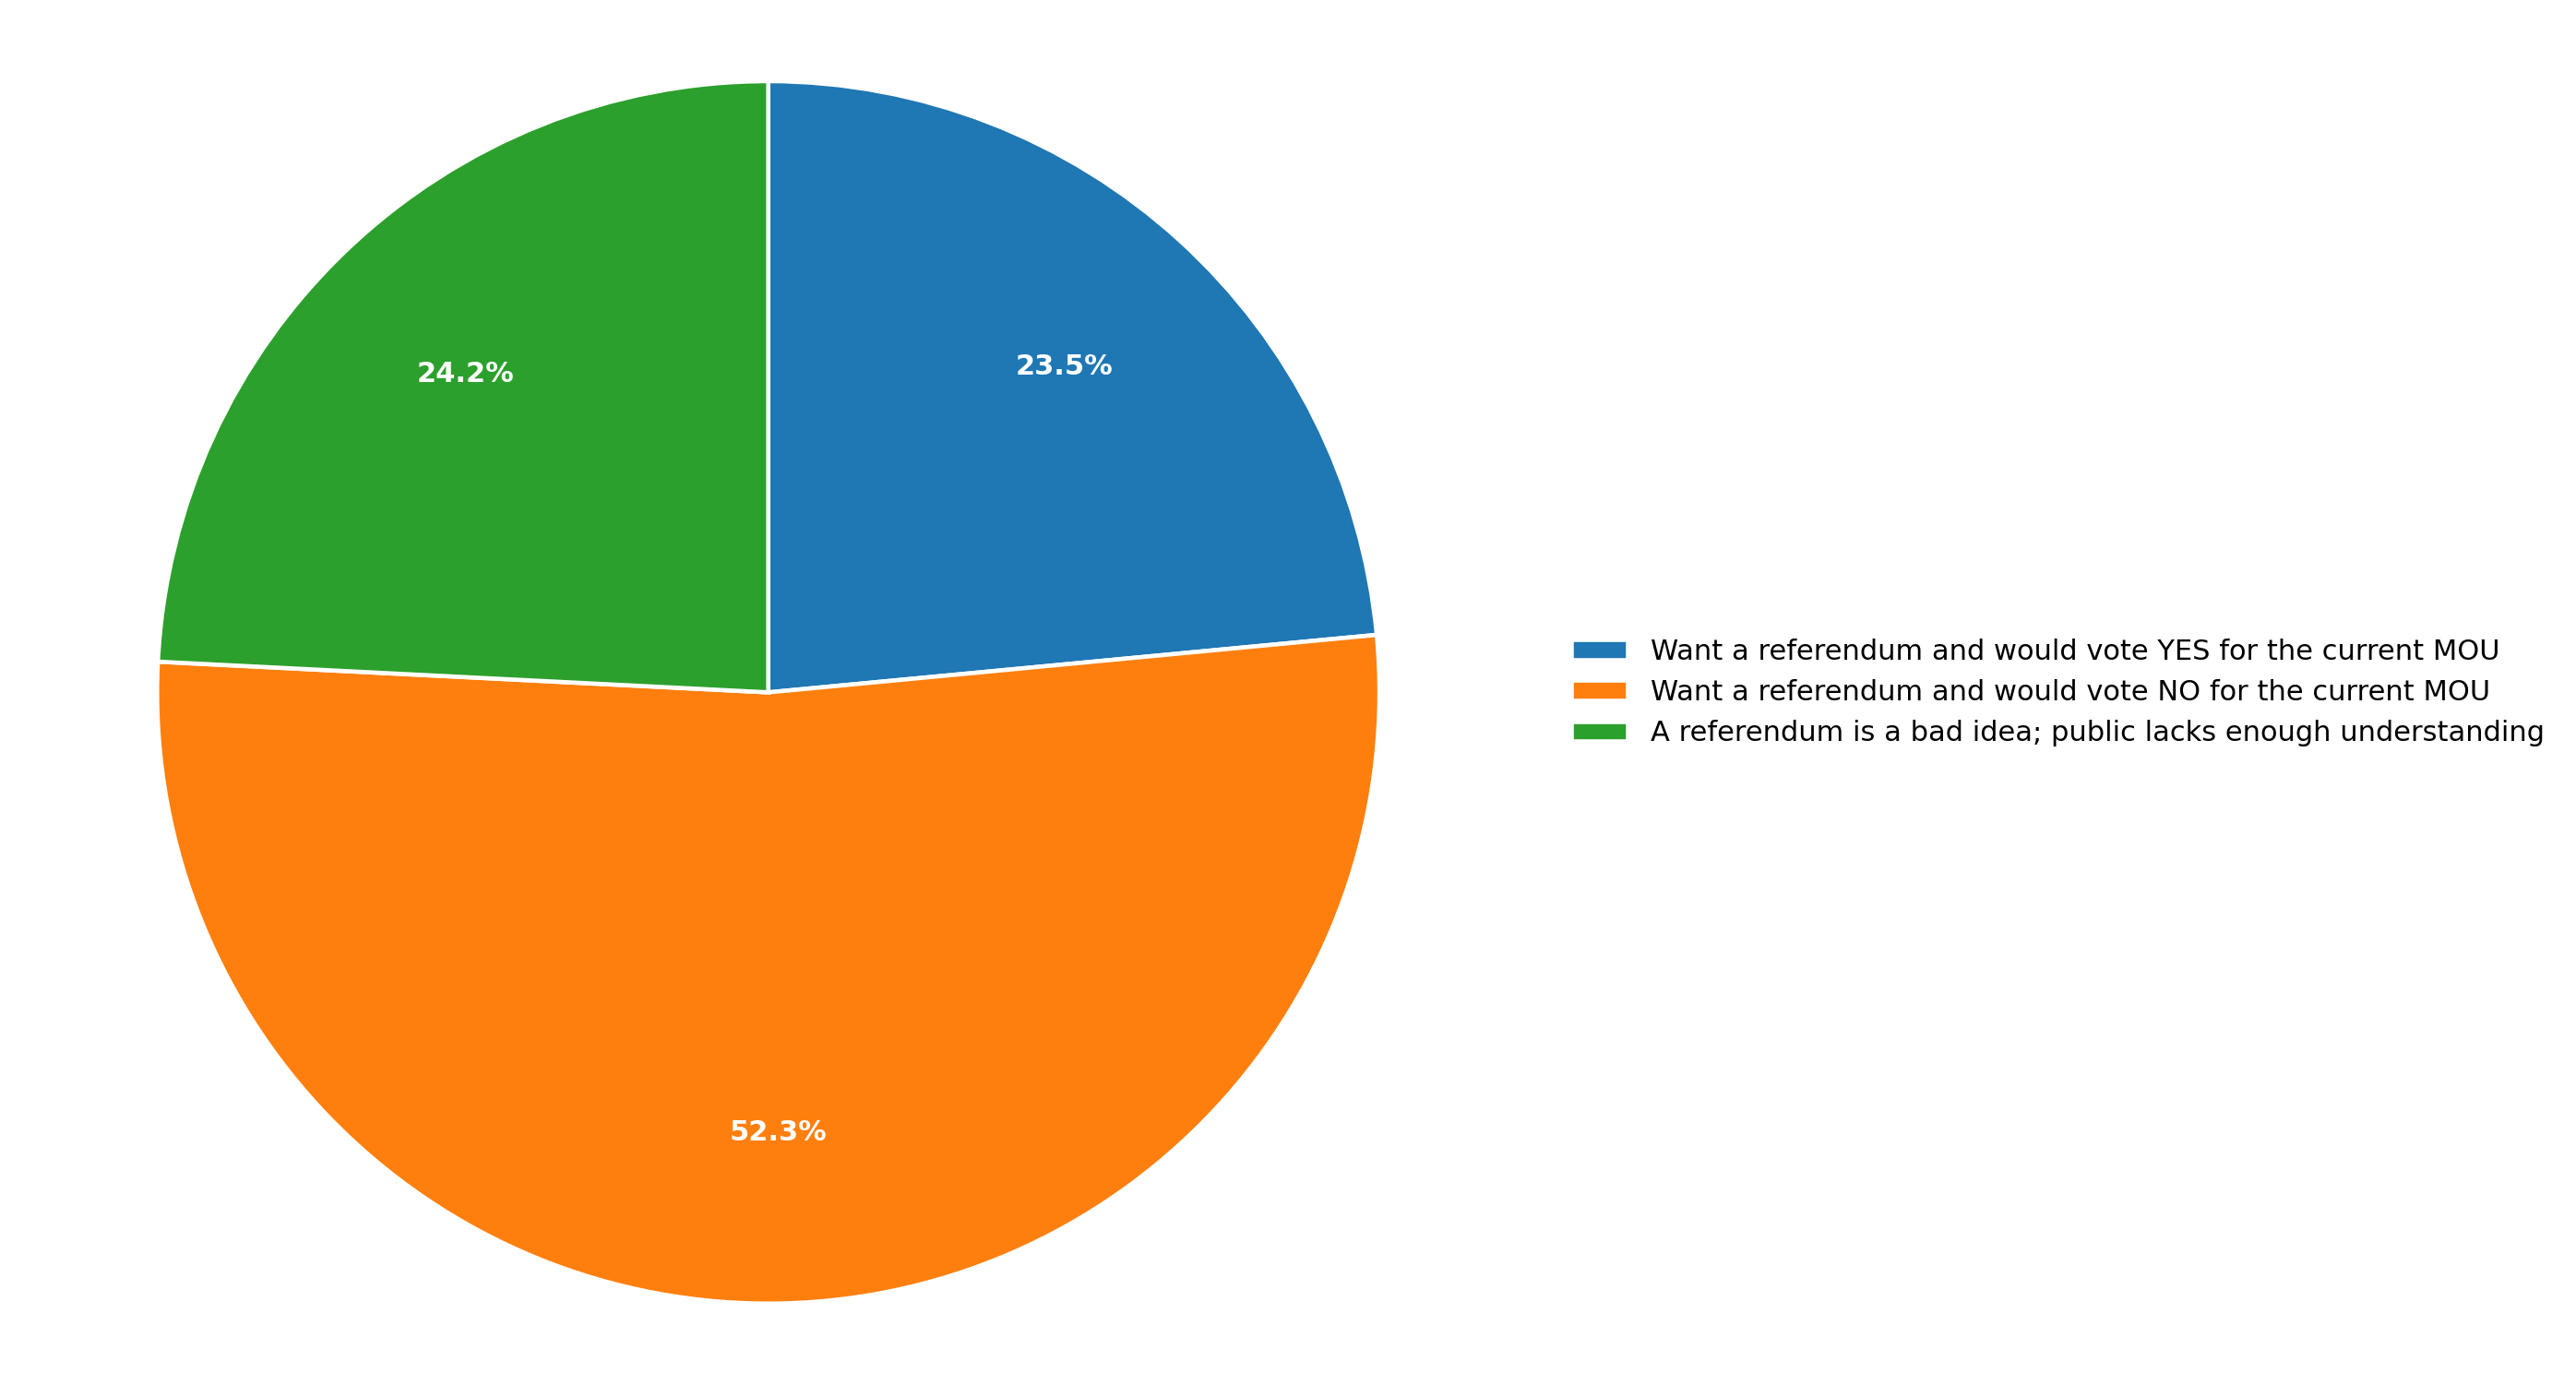
And matching the opinions seen on the MOU as a whole, over half of all decided NDP voters indicate they want a referendum and would vote NO on the current MOU. This is an interesting datapoint, as the original MOU was quite popular in left-leaning circles, and the idea of a referendum on the MOU was mocked by the same circles during the 2025 election campaign.
Decided NDP Voters
PART 3: The State of Provincial Politics
To be able to match opinions on the MOU and referendum to political alignment, we also asked respondents about their current vote intention, which party they voted for in the 2025 provincial election, and their opinions on Tony Wakeham, John Hogan, and their locally elected MHA.
All Voters
Decided Voters
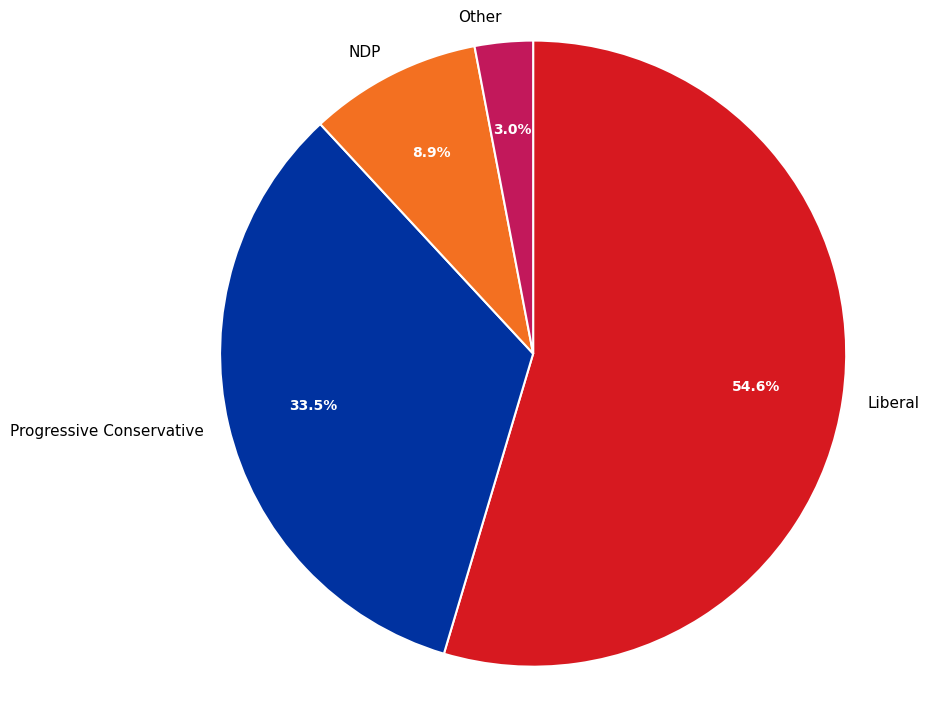
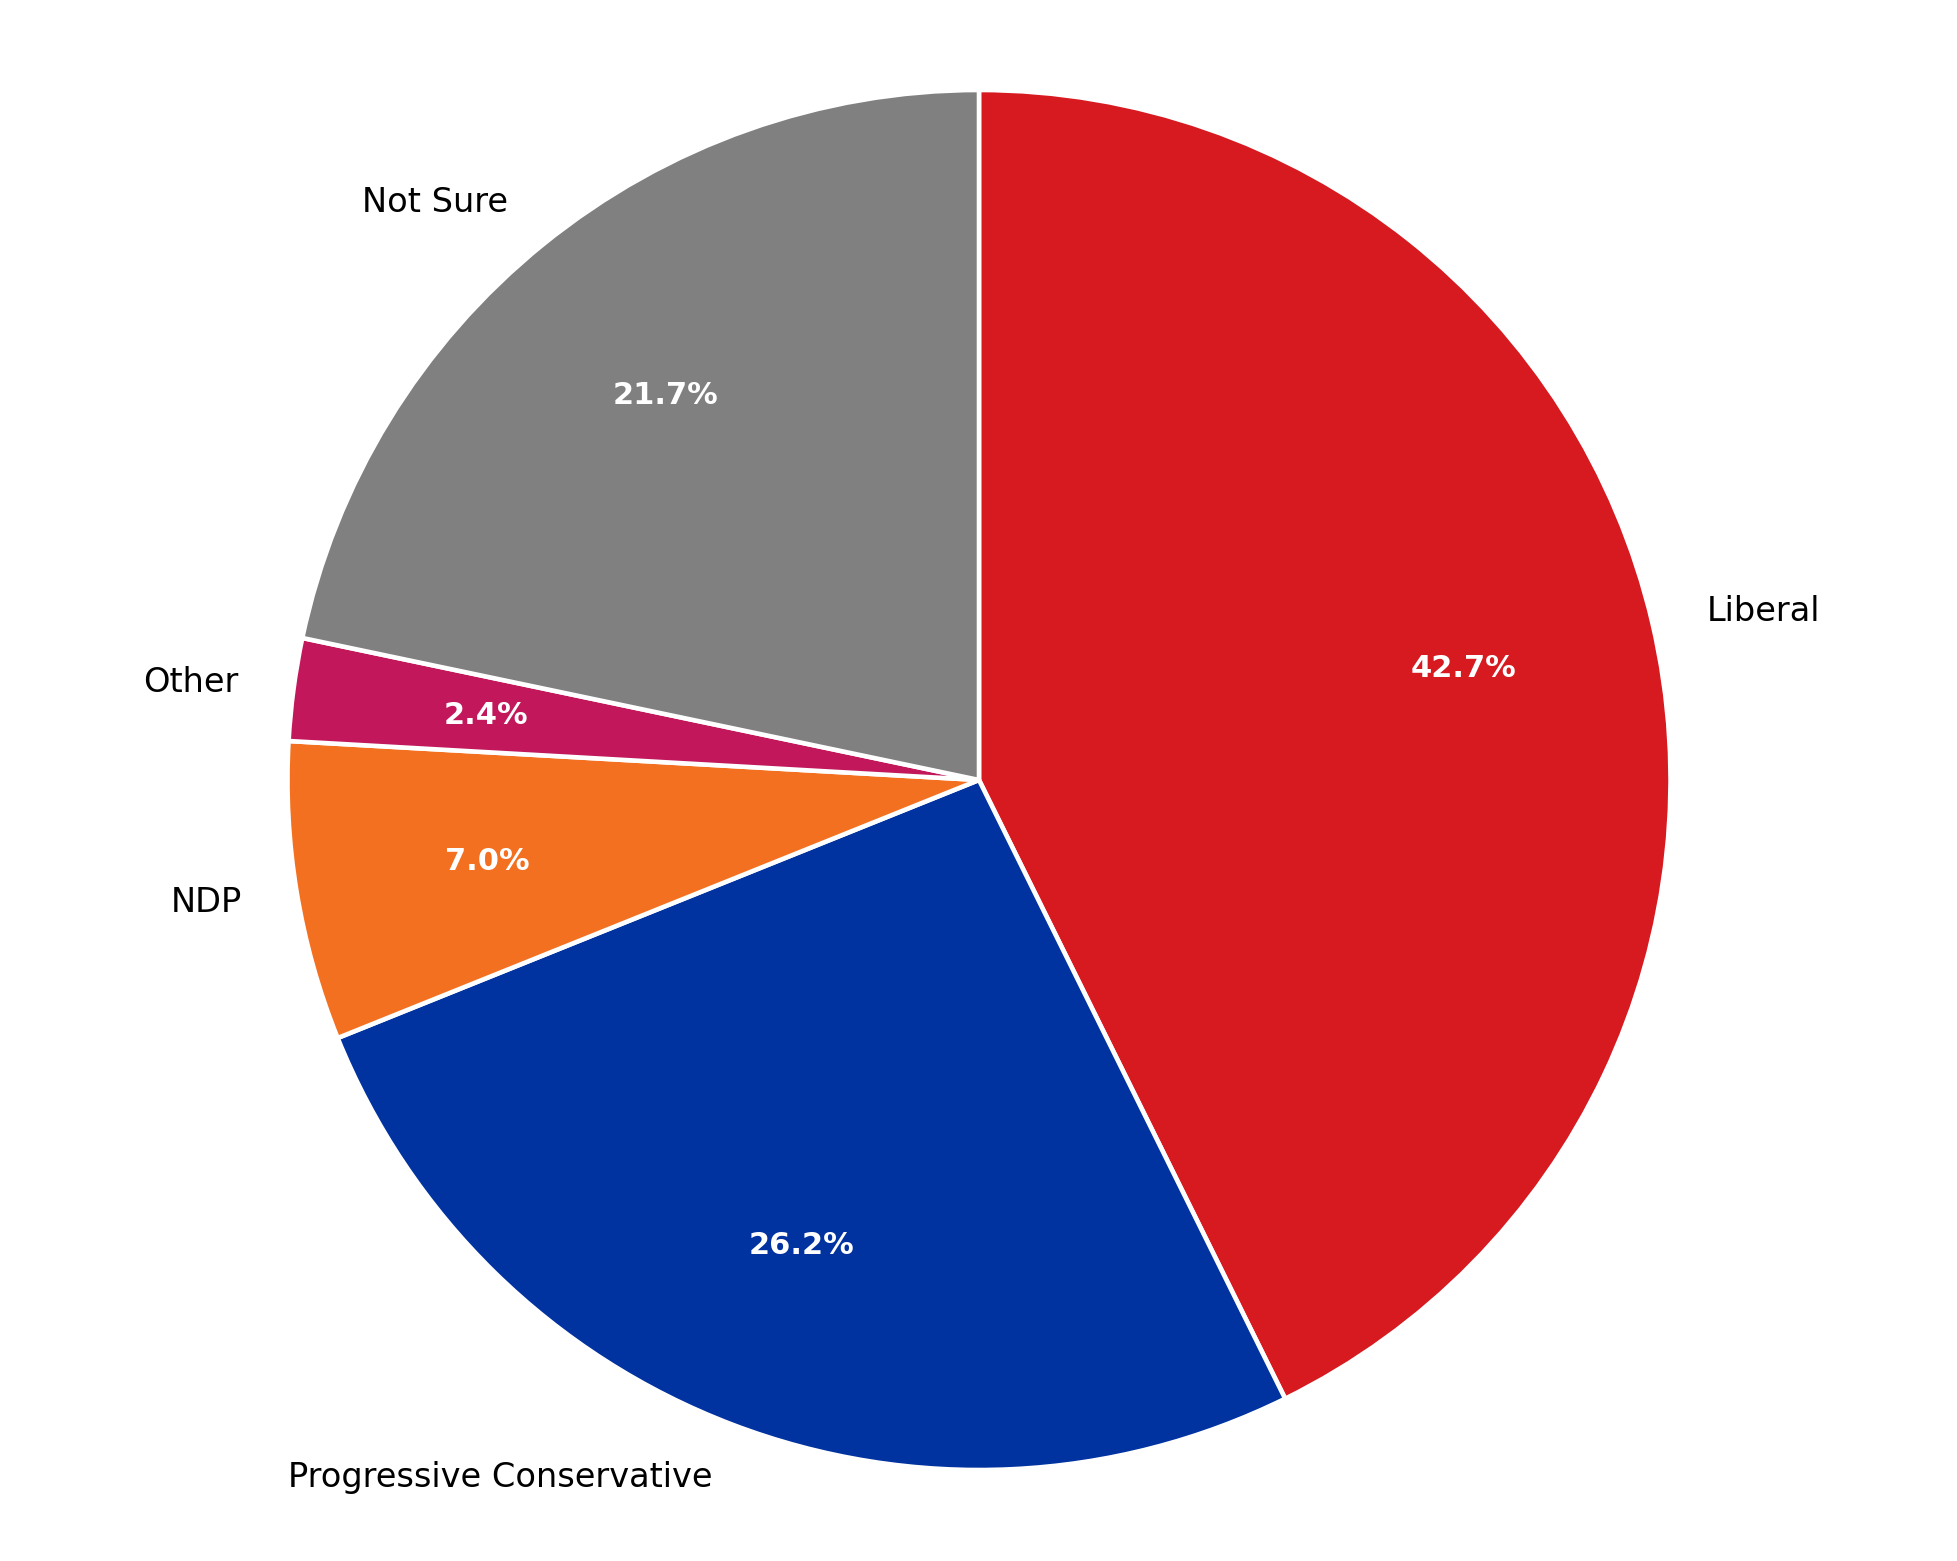
Among decided voters, we see the Liberals with a 21 point lead. Liberals have the strongest support and a dominating lead over all other parties in the St. John's metropolitan region, while the PCs are strongest in rural Avalon, although admittedly we had a very conservative Avalon sample which is not likely indicative of the region as a whole. Liberals are also much stronger with female voters, whereas male voters are more evenly split between the Liberals and PCs.
A word of caution though. We also asked respondents how they voted in the 2025 provincial election, and we noticed very high voter retention among the Liberals and PCs. 90% of decided Liberal voters voted Liberal in the 2025 election. Similarly, we saw that 86% of decided PC voters voted PC in the 2025 election. This seems to indicate that there may not necessarially be a large shift in vote, but instead that PC voters may be underrepresented here, an issue which plagued the 2025 Newfoundland and Labrador election campaign polling, and is generally an issue (albeit a much smaller issue) across the country as a whole.
We do note that NDP vote retention is a bit lower, with a fair amount of their vote bleeding over to the Liberals, however whether this would result in a dramatically different electoral map is questionable.
Satisfaction of Wakeham, Hogan, and elected MHAs
Despite a somewhat divided electorate, we found that Tony Wakeham has a +18 net satisfaction level, with positive net satisfaction numbers across all demographics and regions of the province. Highest satisfaction numbers were found in males, the age range of 18-34, and in eastern and central Newfoundland. The story is a little different when looking at net satisfaction by decided vote: among decided PC voters Tony Wakeham has a +75 net satisfaction rating, while among decided Liberal voters Wakeham as a -5 net satisfaction, and with NDP voters Wakeham is sitting at a -47 net satisfaction rating.
John Hogan shares very similar numbers to that of Tony Wakeham, with a +24 net satisfaction level. Hogan too has positive net satisfaction numbers across all demographics and regions, with the exception of rural Avalon, which may be impacted by the conservative-friendly sample from that region. Highest satisfaction numbers were found in females, the age range of 35-54, and in western Newfoundland + Labrador. John Hogan has a whopping +83 net satisfacion rating among decided Liberal voters, while decided PC voters have a -58 net satisfaction of Hogan. Decided NDP voters are more favourable of Hogan over Wakeham, with a +22 net satisfaction.
Elected MHAs are enjoying high satisfaction numbers across all demographics and regions, with a +53 net satisfaciton among all respondents. All demogrpahics and regions have a net positive satisfaction for their elected MHAs, indicating content with their locally elected members. This should be no surprise to anyone who follows Newfoundland politics, where local MHAs and MPs can become quite popular, no matter their political affiliation.
PART 4: The State of Federal Politics in Newfoundland & Labrador
We also asked respondents their opinions on Federal politics, including their opinions on Prime Minister Mark Carney, opposition leader Pierre Poilievre, as well as their locally elected MP.
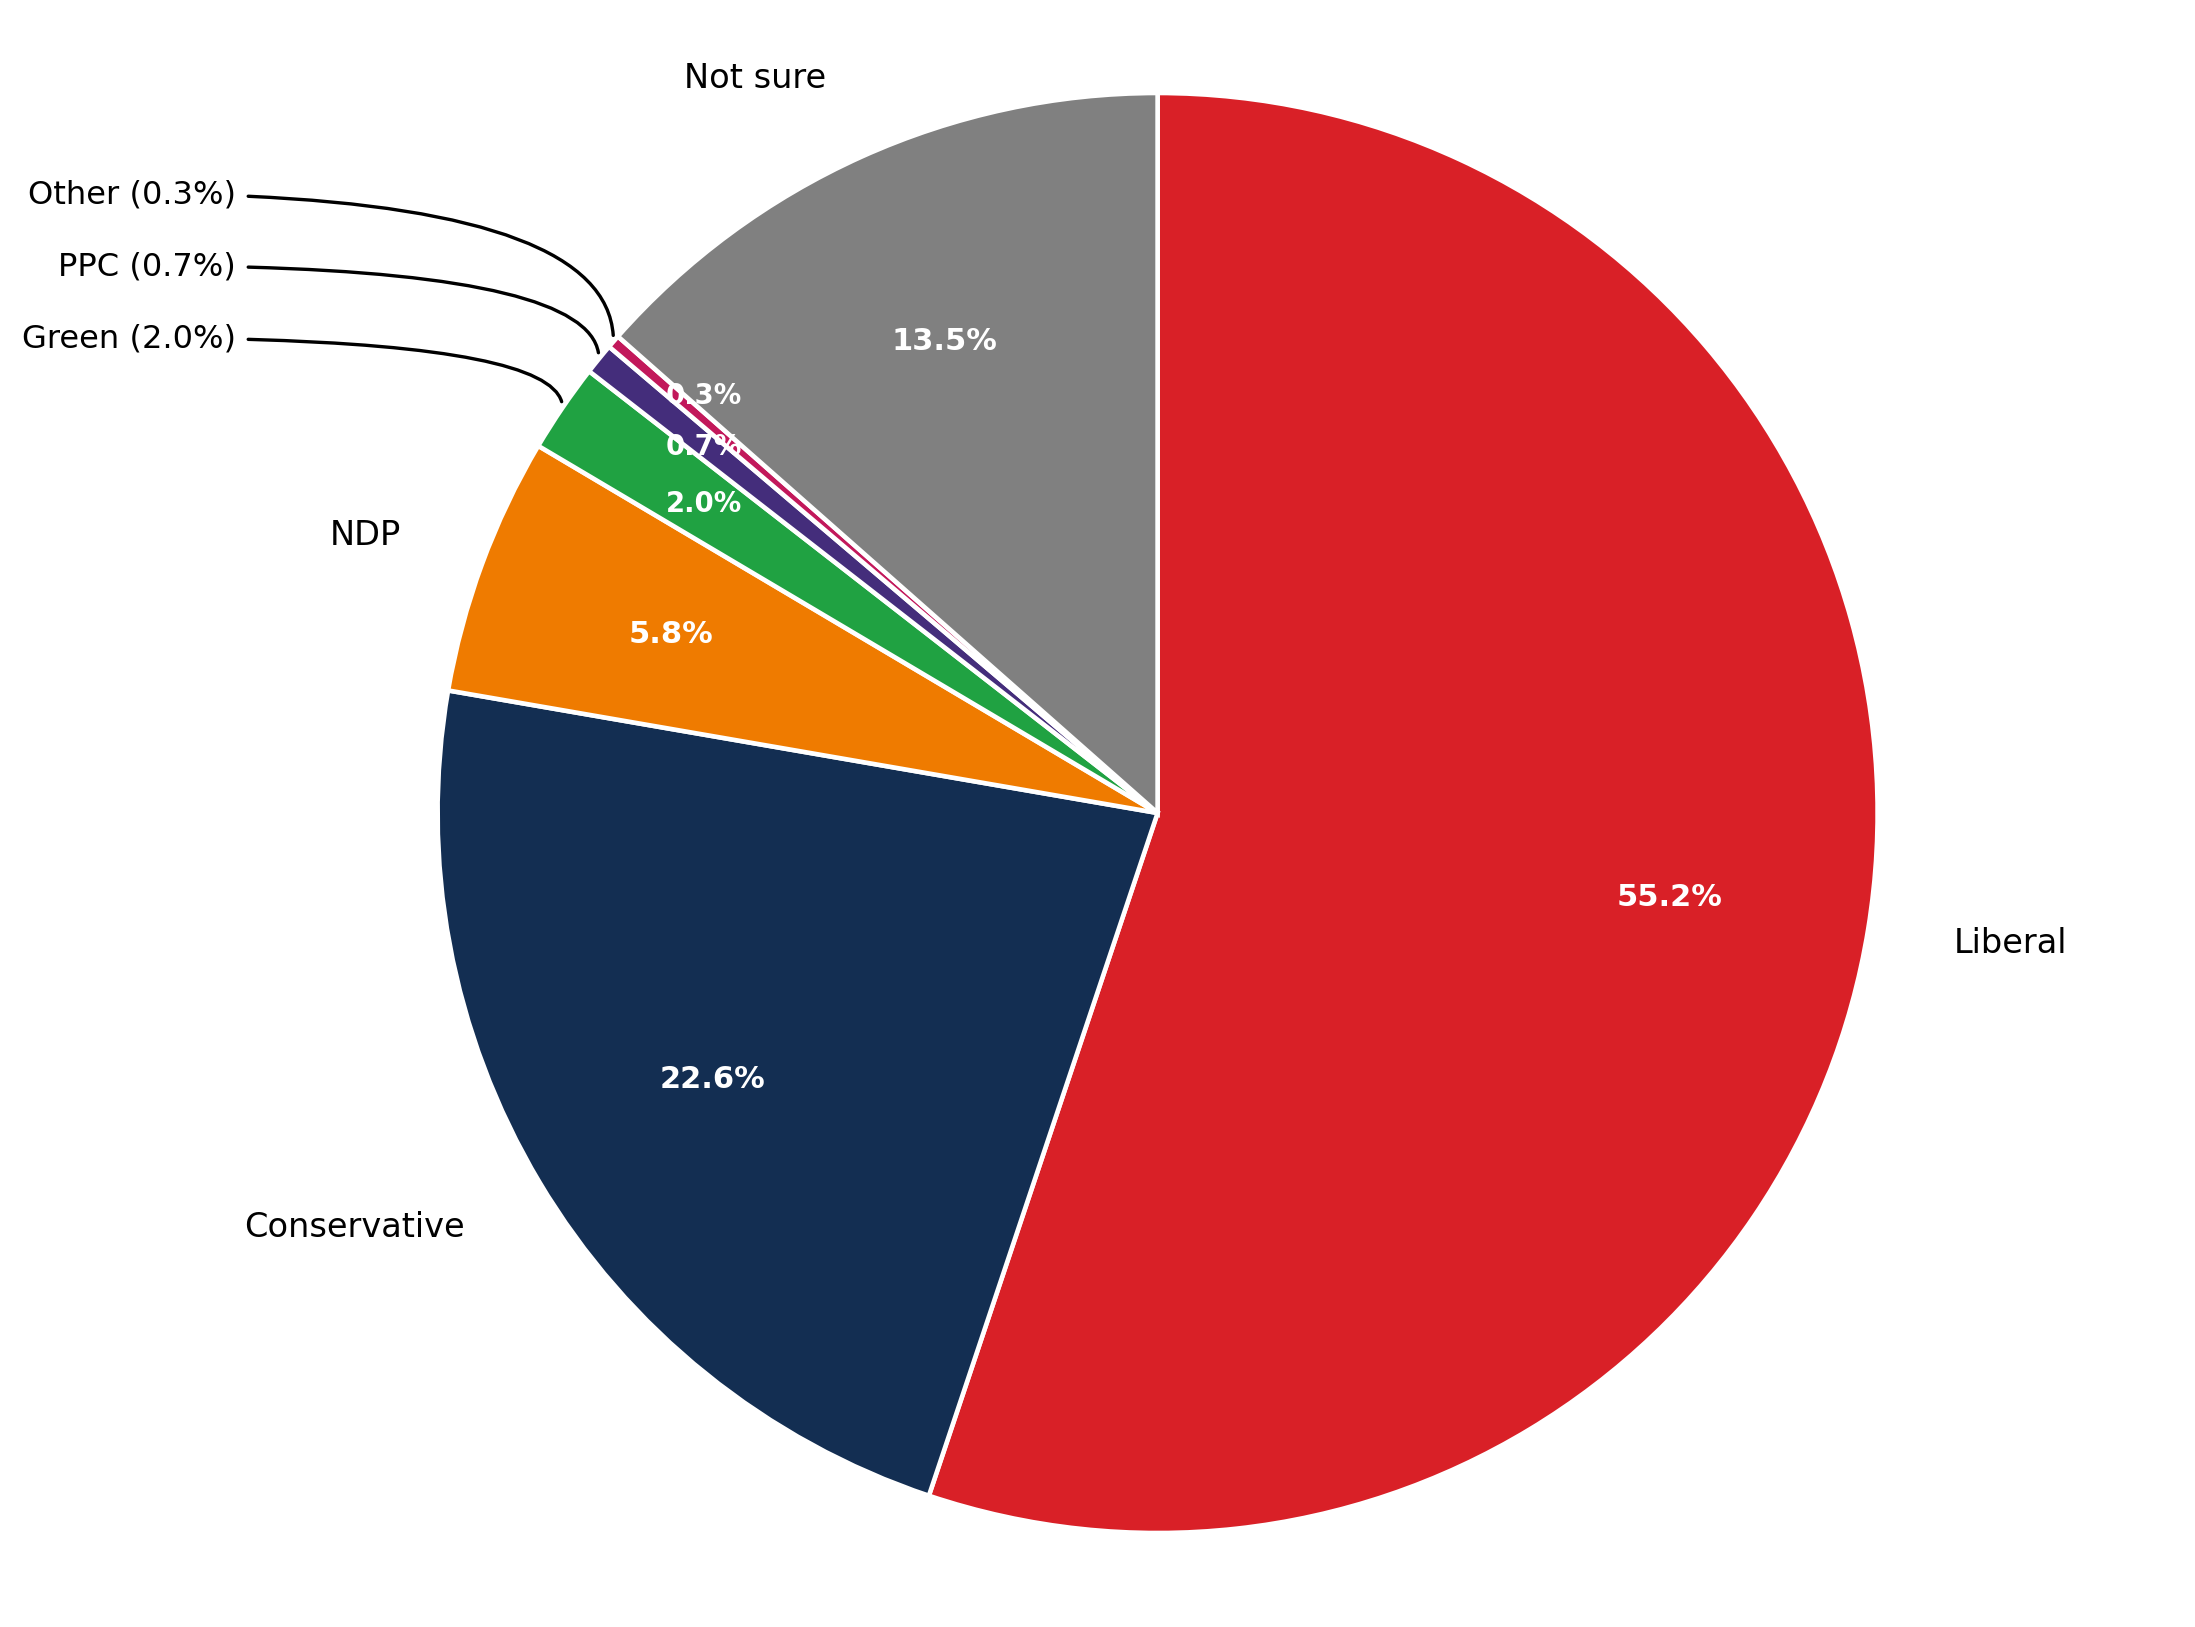
All Voters
Decided Voters
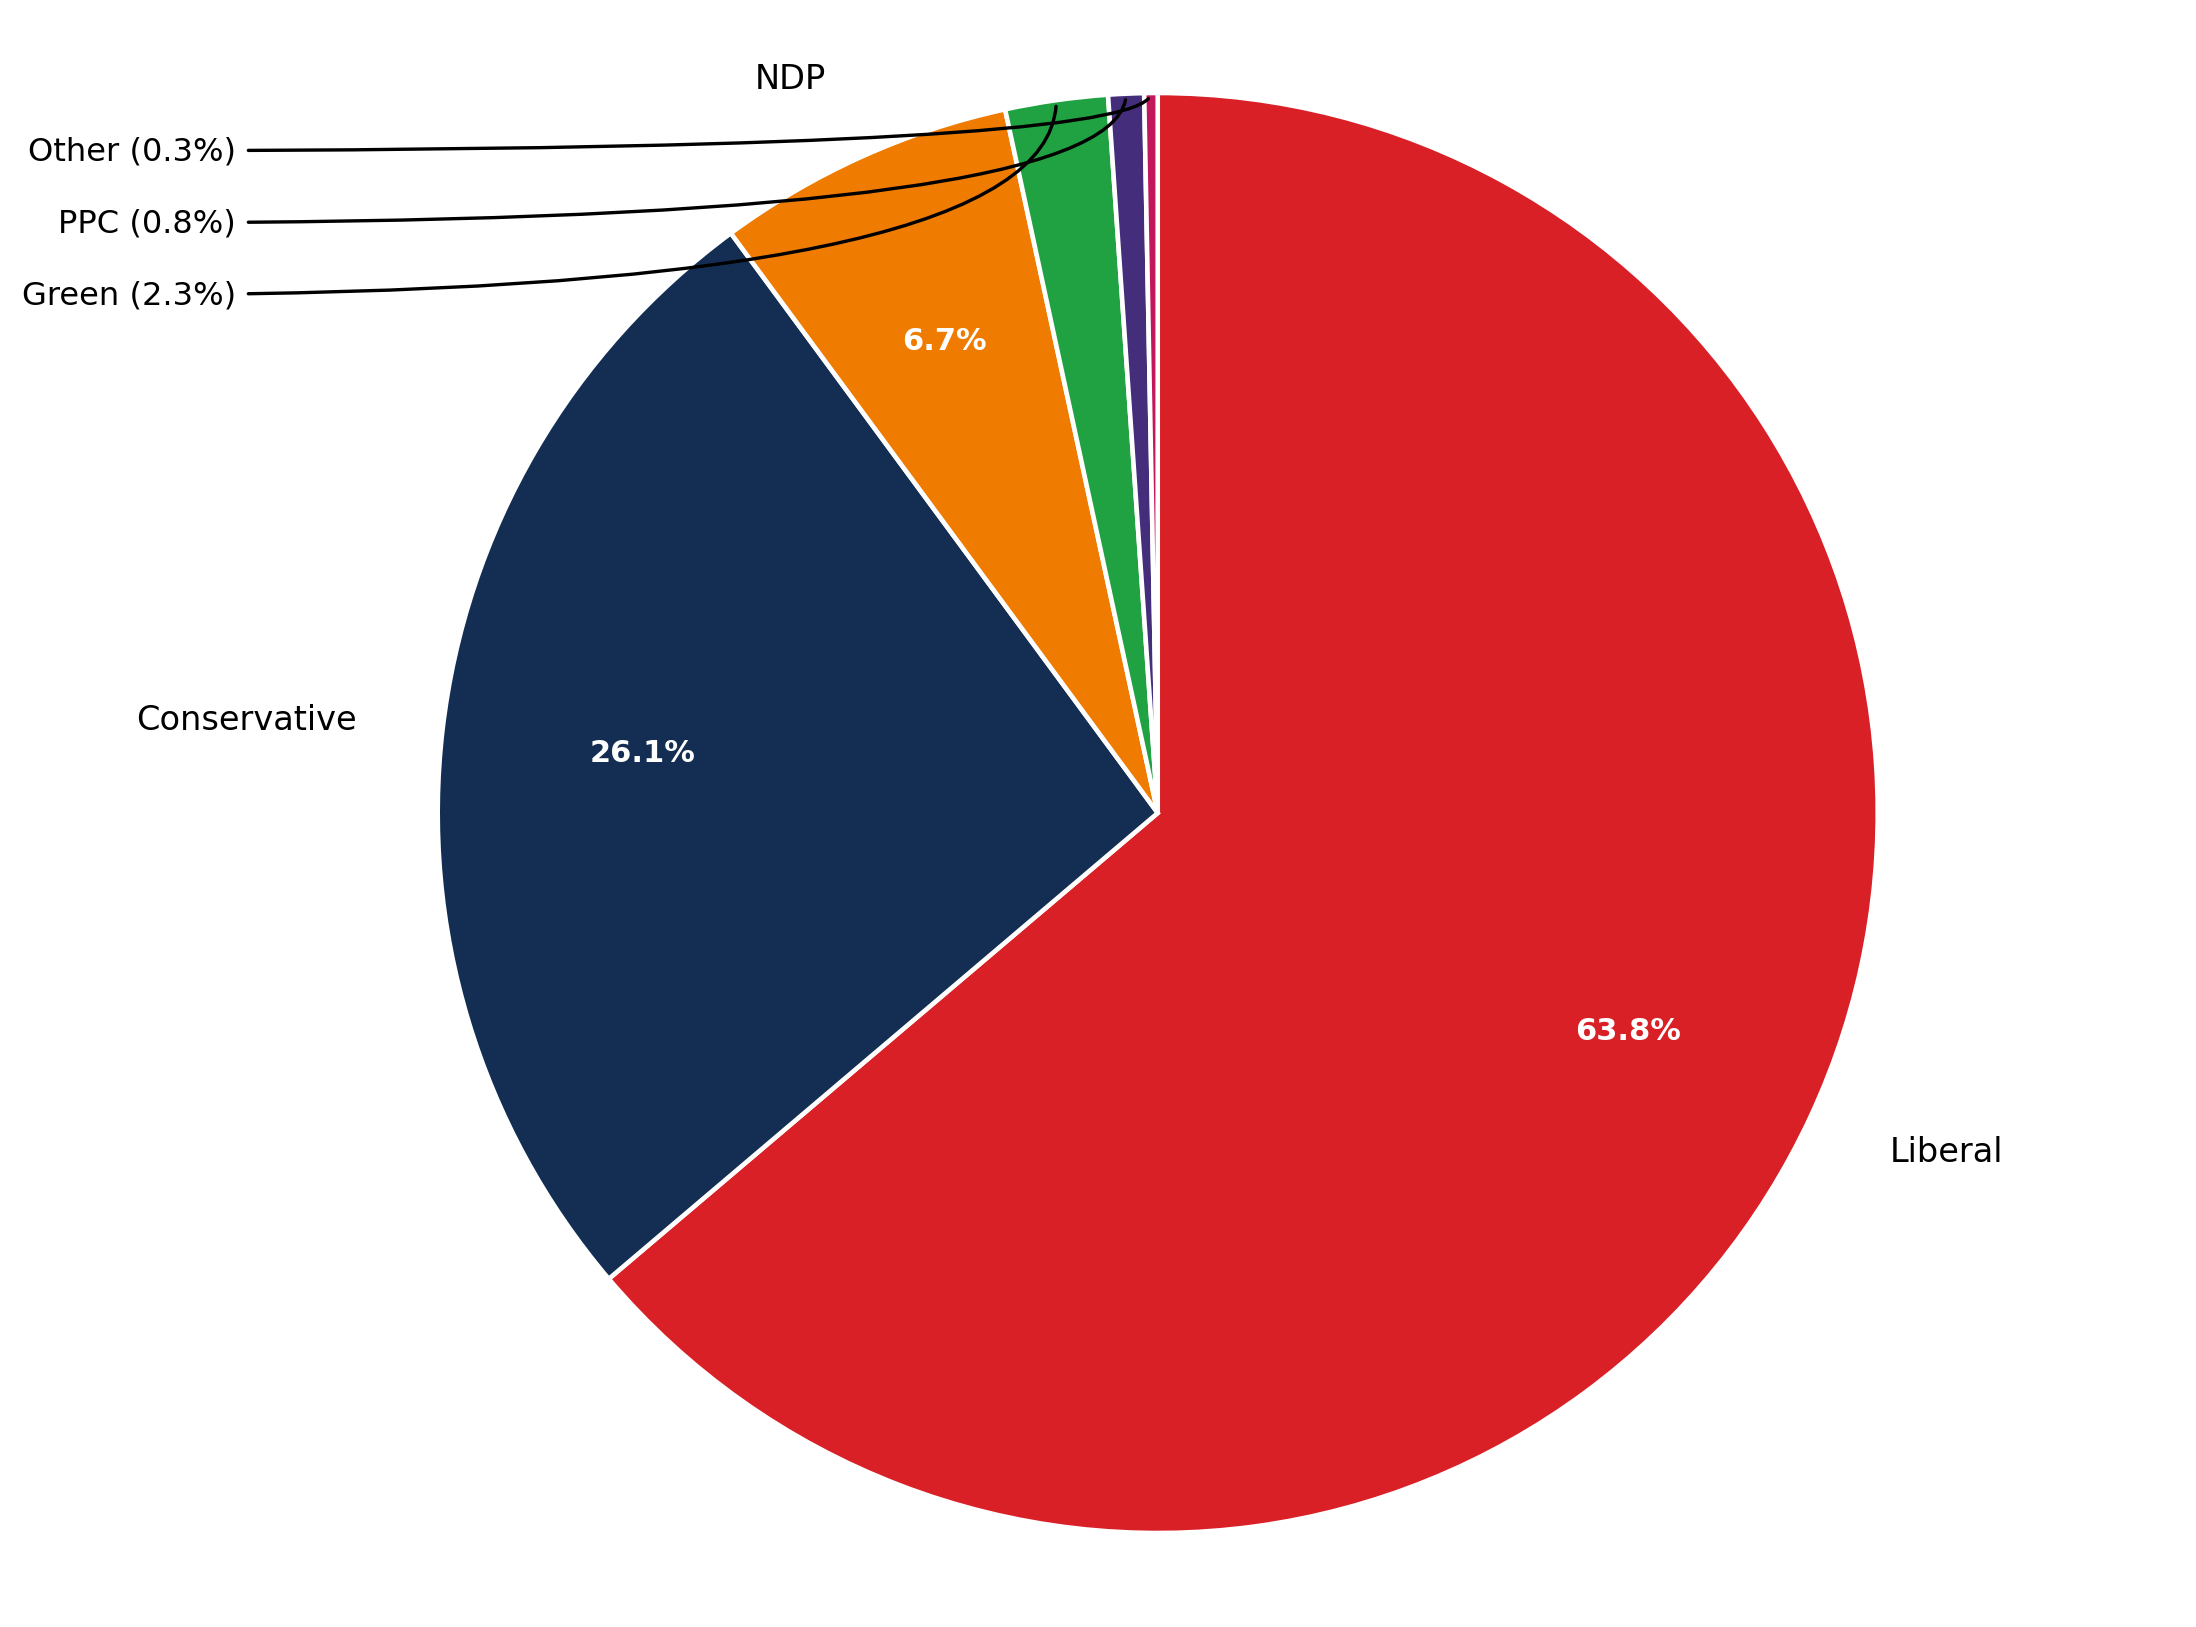
Among decided voters, the Liberals appear to have a commanding 38 point lead over the Conservatives. Support for the Liberals is highest in the 55+ demographic, and from respondents living in the St. John's region. Conservative support is highest in the rural Avalon, but once again the conservative friendly sample of Avalon is not likely indicative of a shift in voter intention.
However, similar to provincial vote intention, we asked respondents which party they voted for in the 2025 Federal election. Again, we see very high voter retention among Liberal and Conservative voters. 95% of decided Liberal voters also voted Liberal in the 2025 Federal election. Similarly, among decided Conservative voters 89% of decided Conservative voters voted Conservative in the 2025 Federal election. Consequently, there does not appear to be a large shift in voter intention and we may just be undersampling conservative voters, especially in rural parts of the province.
Satisfaction of Carney, Poilievre, and elected MPs
Prime Minister Mark Carney is posting terrific net satisfaction numbers, with a total +66 net satisfaction among all respondents. All demographics and regions have a net positive satisfaction for the Prime Minister, with a whopping +93 in eastern and central Newfoundland. When sorted by vote intention, Mark Carney boasts an incredible +97 net satisfaction amongst decided Liberal voters, and a +45 amongst decided NDP voters. Decided Conservative voters have a more negative view of Mark Carney, with said conservatives showing a -17 net satisfaction of the Prime Minister.
Satisfaction of oppositon leader Pierre Poilievre is the polar opposite of the Prime Minister. Poilievre sits at a -20 net satisfaction among all voters, with negative net satisfaction across all demographics and regions with the exception of 2: voters between the ages of 18-34 where Poilievre has a net +23 satisfaction, and the voters of rural Avalon with a net satisfaction of +33 (I need not mention this weird sample again). Among decided voters, decided Liberal (-59 net satisfaction) and decided NDP (-55 net satisfaction) have very poor views on Pierre Polievre, while decided Conservative voters appear to have a much better view of their leader, with a +82 net satisfaction.
Elected MPs all appear to be enjoying high levels of satisfaction across all regions of the province, with a total +51 net satisfaction across all respondents. Net satisfaction is high across all regions of the province, which may be a positive sign for Conservative MPs Carol Anstey, Jonathan Rowe, and Clifford Small, who are clearly much more popular than the leader of their party.
PART 5: Opinions on US President Donald Trump
If we were going to ask about Federal politics, then we may as well have also asked about respondents opinions on US President Donald Trump, who is a very divisive figure here in Canada.
Respondents Opinion on Donald Trump
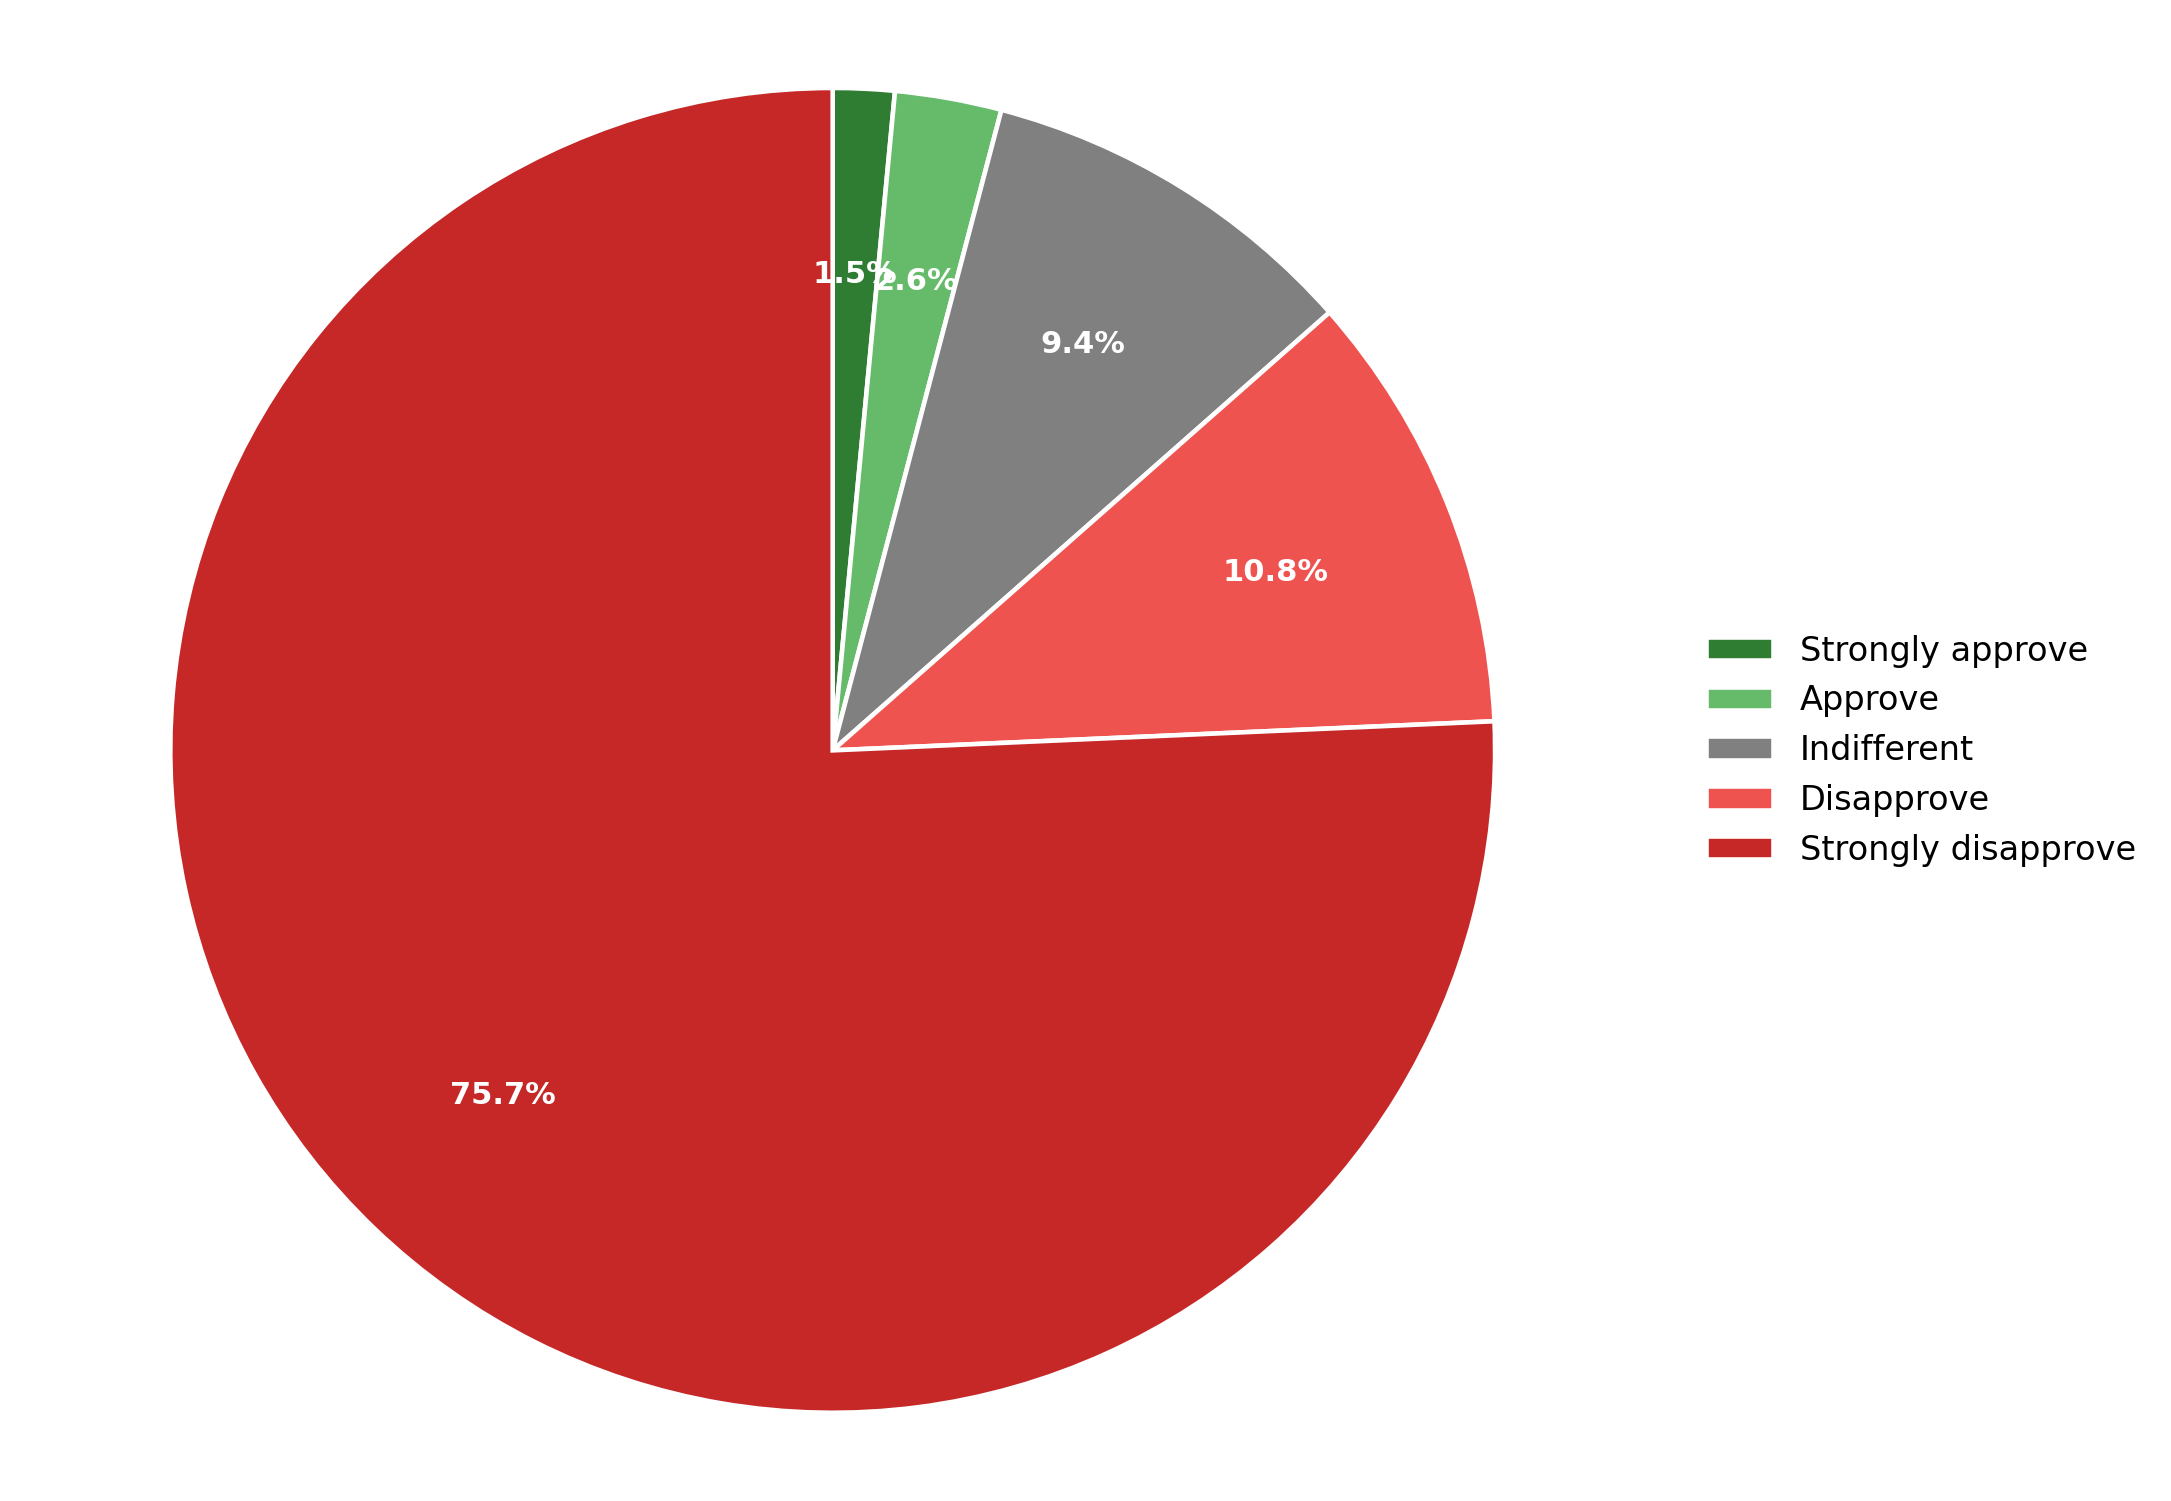
It should come as no surprise that 86% of respondents disapprove or strongly disapprove of US President Donald Trump. Of all respondents, only 4% approve of the President. Net approvals are downright awful all across the board, and the best demographic for Trump approval is within the 18-34 age group, with an abysmal -77 net approval. When broken out by decided provincial vote, decided Liberal and decided Progressive voters share similar sentiments towards Donald Trump, with net approvals of -93 and -90, respectively. Funnily enough, the decided NDP sample is softer towards Donald Trump, albeit with a paltry -68 net approval.
Similar numbers are seen when broken out by decided Federal vote. Among decided Liberal voters, US President Donald Trump boasts a -95 net approval, while among decided Conservative voters Trumps net approval is -92. Again, the NDP show the softest support for Trump, albeit at a -52 net approval.